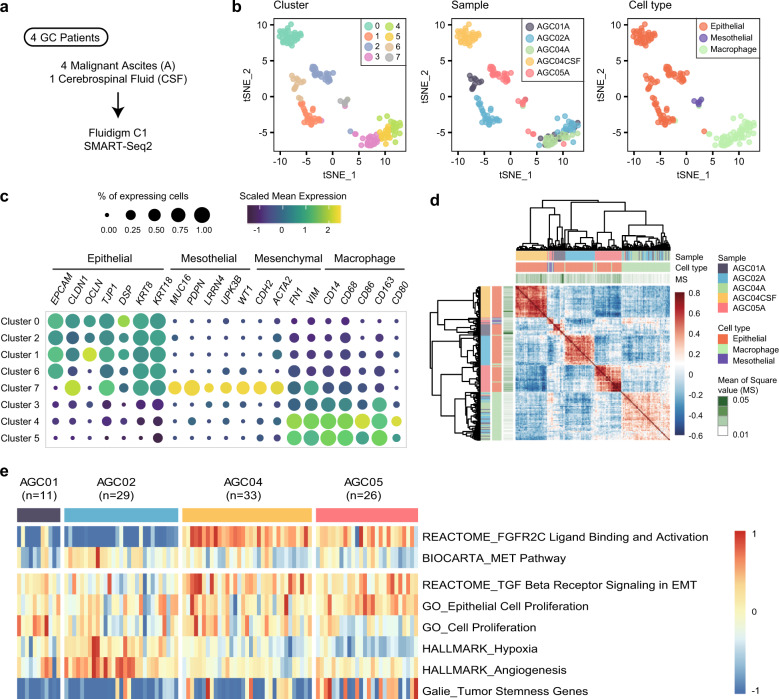
Fig. 1. Characterization of tumor cells and tumor-associated macrophages in malignant ascites.
a Scheme of data generation in the study. b Dimension reduction using t-distributed stochastic neighbor embedding (tSNE) separates noncancerous cell clusters and patient-specific cancer cell clusters. Each dot represents a cell, and each cell is colored by its SNN cluster (left), sample origin (middle), or cell type (right). c The expression of marker genes for epithelial cells, peritoneal mesothelial cells, mesenchymal cells, and macrophages clarified the cell type of the clusters. d Pearson’s correlation coefficient matrix of the CEP values. e Heatmap of tumor characteristics in the tumor cells. Each column represents a single cell.

