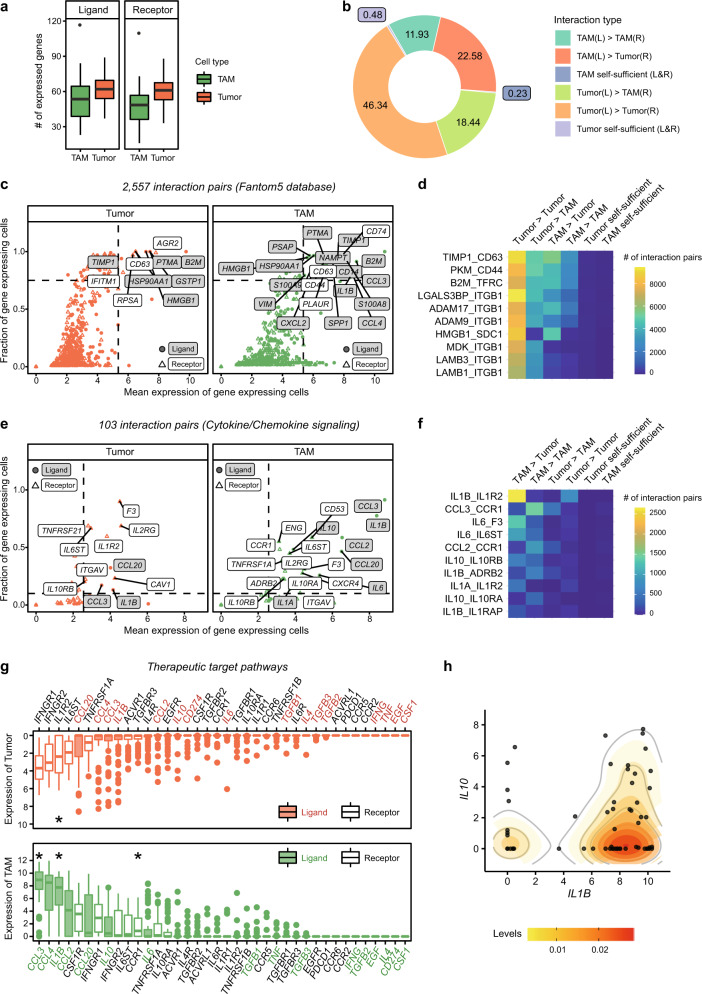
Fig. 2. Tumor-promoting interactions of cancer cells and macrophages in malignant ascites.
a The number of expressed ligand (left) or receptor (right) genes from the FANTOM5 database in each cell. b Putative intercellular interactions between two other cells are much more prominent than was putative self-sufficient signaling. Intercellular interaction types were indicated by ‘ligand-expressing cell (L)>receptor-expressing cell (R)’. c Strongly and commonly expressed interacting genes in tumors (left) or TAMs (right). The genes with average expression over quantile 0.95 and a fraction of expressing cells over 0.75 were labeled. d Top 10 abundant interaction pairs (>10,224 pairs in each interaction) related to c. e Strongly and commonly expressed interacting genes among the chemokine-related interactions (Supplementary Table 1a). Genes with average expression over quantile 0.5 and a fraction of expressing cells over 0.1 were labeled. f Top 10 abundant interaction pairs (>406 pairs in each interaction) related to e. g Expression level of the genes associated with macrophage function (Supplementary Table 1b) indicates high expression of CCL3, IL1B, and CCR1 in macrophages and IL1R2 in tumor cells (marked with a star). h Coexpression of IL1B and IL10 in TAMs. The x and y-axes show the expression levels of IL1B and IL10, respectively. Each dot represents a cell, and each cell was colored based on the sample origin. Expressed genes were evaluated based on threshold 1 in a–f.

