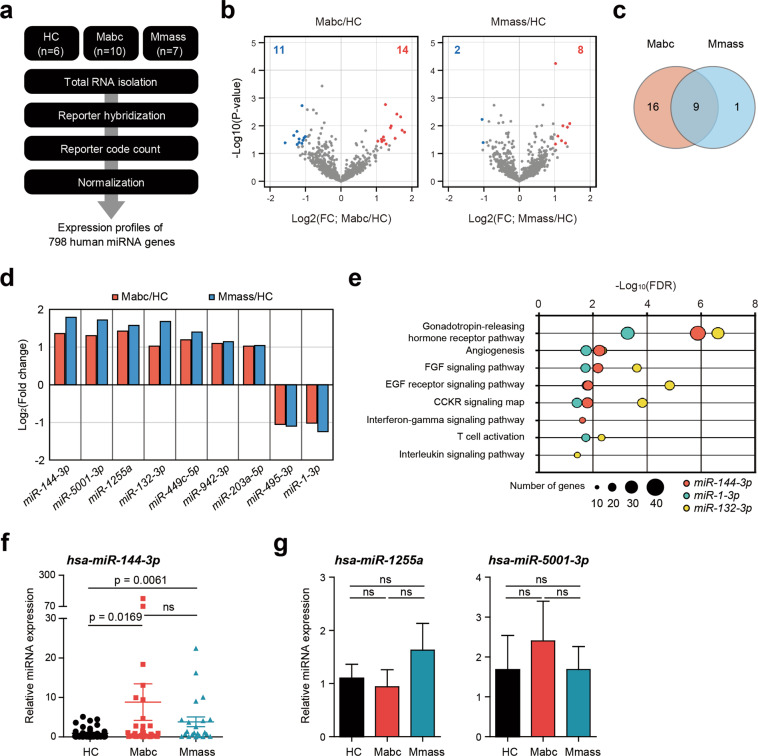
Fig. 3. Expression of miR-144-3p, identified by miRNA transcriptome analysis, is upregulated in PBMCs from the NTM patients.
a Schematic diagram of the miRNA transcriptome analysis. b Volcano plots representing 798 human miRNA genes with the log2-fold change (FC) plotted against the negative log10 adjusted p-value for the Mabc and Mmass groups compared to the HC group. Red and blue dots indicate upregulated and downregulated miRNA genes compared to the HCs. c Venn diagram showing that 9 miRNAs were changed in both patient groups. d Log2-fold changes of 9 common miRNAs of the Mabc and Mmass groups compared to the HC groups. e Results of the Panther pathway enrichment test for the miRNA target genes predicted by TargetScan7.1. f Dot-plot graph depicting miR-144-3p, which is differentially expressed between the NTM patients and the HCs. Human PBMCs were isolated from the HCs (n = 39) and NTM patients (Mabc, n = 31; Mmass, n = 22). Quantitative real-time PCR analysis of miR-144-3p expression. g Human PBMCs were isolated from the HCs (n = 17) and the NTM patients (Mabc, n = 14; Mmass, n = 14), and the expression of miR-1255a or miR-5001-3p was measured by qRT-PCR. ns, not significant; HC, healthy controls; Mabc, patients infected with Mabc; Mmass, patients infected with Mmass. Mann–Whitney U test. Values represent the mean (±SEM) from three independent experiments performed in triplicate (f, g). HC healthy controls, Mabc M. abscessus subsp. abscessus, Mmass M. abscessus subsp. massiliense.

