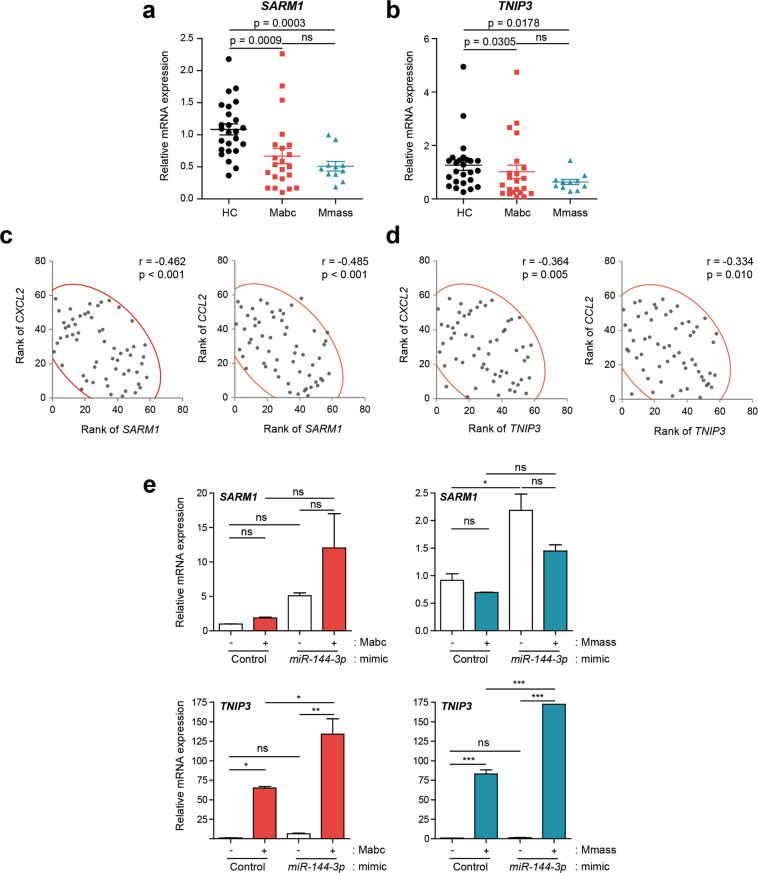
Fig. 5. Transcriptional analysis of SARM1 and TNIP3 in PBMCs between the NTM patients and the HCs.
a, b Dot-plot graph depicting cytokine/chemokine genes that are differentially expressed between NTM patients and HCs. Human PBMCs were isolated from HC (n = 25) and NTM patients (Mabc, n = 22; Mmass, n = 11) and SARM1 (a) and TNIP3 (b) mRNAs were determined using quantitative real-time PCR analysis. Mann–Whitney U test. c, d Correlation analysis between SARM1 and CXCL2/CCL2 (c) and TNIP3 and CXCL2/CCL2 (d). e Human primary MDMs were transfected with mimic negative control (Control) or miR-144-3p mimic (10 nM) for 24 h and then infected with or without Mabc or Mmass (MOI = 2, for each; for 3 h). Quantitative real-time PCR analysis of TNIP3 and SARM1 expression. *p < 0.05, **p < 0.01, and ***p < 0.001. Spearman correlation (c, d); one-way ANOVA (e). Data are representative of three or four independent experiments performed in duplicate. HC healthy controls, Mabc M. abscessus subsp. abscessus, Mmass M. abscessus subsp. massiliense.

