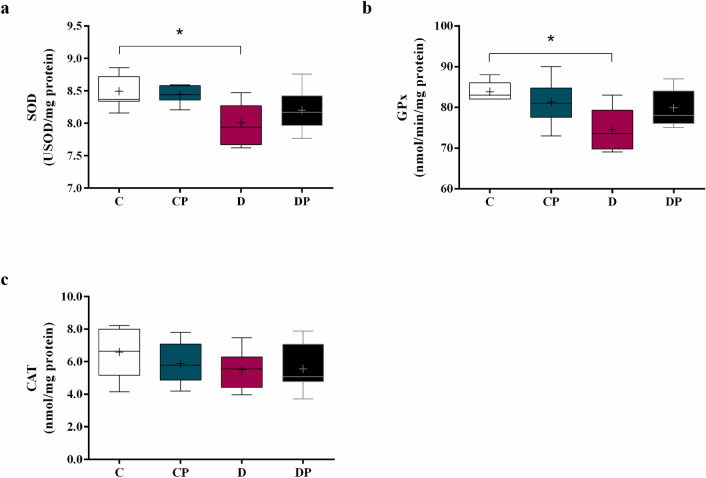
Figure 8.
Activity of (a) superoxide dismutase (SOD), (b) glutathione peroxidase (GPx) and (c) catalase (CAT) in hepatic tissue of control (C), control + probiotic (CP), diabetic (D) and diabetic + probiotic (DP) groups (n = 6–9/group). Data are from C57BL/6 STZ-induced diabetic mice, + /- Saccharomyces boulardii (0.5 × 10⁸ colony-forming units, THT 500,101 strain, Probiotics and Starters Cultures, Belgium) for 8 weeks. A horizontal line inside the box indicates the median value of the samples within each group, and the upper and lower edges of the box indicate the quartiles. For (a) significance was determined by Two-way ANOVA followed by Tukey’s test. For (b, c) results were evaluated with Kruskal–Wallis, followed by Dunn’s test. + indicates mean value (GraphPad Prism 6). * p ≤ 0.05.

