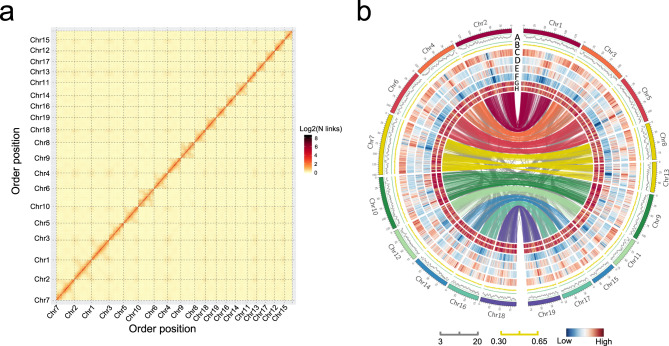
Fig. 1. Overview of the M. lutarioriparius genome assembly.
a Genome-wide Hi-C map of M. lutarioriparius. Post-clustering heatmap shows density of Hi-C interactions between contigs from LACHESIS pipeline. b Circos plot of M. lutarioriparius genome assembly. The outermost layer of colored blocks is a circular representation of the 19 pseudochromosomes, with scale mark labeling each 5 Mb. The LTR Assembly Index (LAI) score is shown in track (A). The density of GC content (B), gene (C), Gypsy (D), Copia (E), DNA TE (F), transcriptome expression level of rhizome (G), and lateral bud (H) were calculated using 100 kb non-overlap window. The innermost layer shows inter-chromosomal synteny, with colored upper-layer links representing syntenic blocks generated from the recent M. lutarioriparius WGD, and the gray low-layer links representing homologs generated from older duplications.

