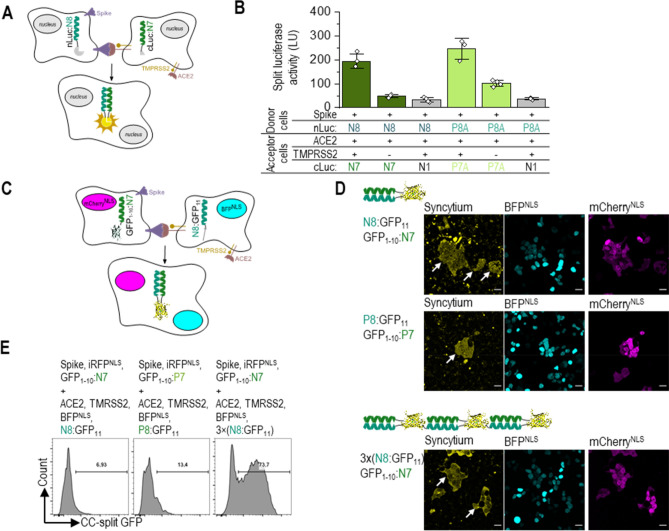
Figure 5.
SARS-CoV-2 viral Spike protein-mediated syncytium formation assay based on designed CC split enzymes (A) Schematic representation of S protein-mediated cell–cell fusion assay. The donor cell is identified as the cell co-expressing CoV-2 Spike protein and nLuc:N8, the acceptor cells with co-expression of ACE2 receptor, TMPRSS2, and cLuc:N7. Syncytium formation is detected with reconstituted CC-split luciferase activity. (B) Luciferase activity as an indicator of cell fusion. 24 h after transfection, donor HEK293T cells transfected with plasmids expressing nLuc:N8 or nLuc:P8A (1000 ng), CoV-2 Spike-protein (10 ng), and acceptor cells expressing cLuc:N7 or cLuc:P7A or cLuc:N1 as control (1000 ng), ACE2 (20 ng), with or without TMPRSS2 (30 ng) were mixed in 1:1 ratio. Luciferase activity was measured 3 h later. The values represent the means (± s.d.) from four independent cell cultures, individually transfected with the same mixture of plasmids, and are representative of two independent experiments. (C) Schematic representation of syncytium formation between the donor cells expressing CoV-2 Spike protein, CC-split GFP and mCherryNLS, and the acceptor cells expressing ACE2 receptor, TMPRSS2, CC-split GFP, and BFPNLS. The fused cells are identified with BFP and mCherry nuclei and reconstituted CC-split GFP. (D) Confocal microscopy images of a mixture of donor HEK293T cells expressing the CoV-2 Spike protein (25 ng), mCherryNLS (500 ng), and GFP1-10:N7 or GFP1-10:P7 (100 ng) and the acceptor cells expressing ACE2 receptor (40 ng), TMPRSS2 (40 ng), BFPNLS (120 ng), and N8:GFP11, P8:GFP11 or 3 × (N8:GFP11) (100 ng). After 3 h mixing of donor and acceptors cells, syncytia (indicated with an arrow) were observed by a reconstituted GFP (yellow) and co-localization of BFP (cyan) and mCherry (magenta). (E) Flow cytometry analysis of a mixture of donor cells expressing the CoV-2 Spike protein (50 ng), iRFPNLS (50 ng), and GFP1-10:N7 or GFP1-10:P7 (500 ng) and the acceptor cells expressing ACE2 receptor (250 ng), TMPRSS2 (50 ng), BFPNLS (50 ng), and N8:GFP11, P8:GFP11 or 3 × (N8:GFP11) (650 ng). Percent of reconstituted split GFP for double iRFP and BFP positive cells 3 h after mixing donor and acceptor cells. For gating strategy, see Fig S8B. Representative results of two independent experiments are shown. For amounts of plasmids, see Table S2. Statistical analyses and the corresponding p-values are listed in Table S3.

