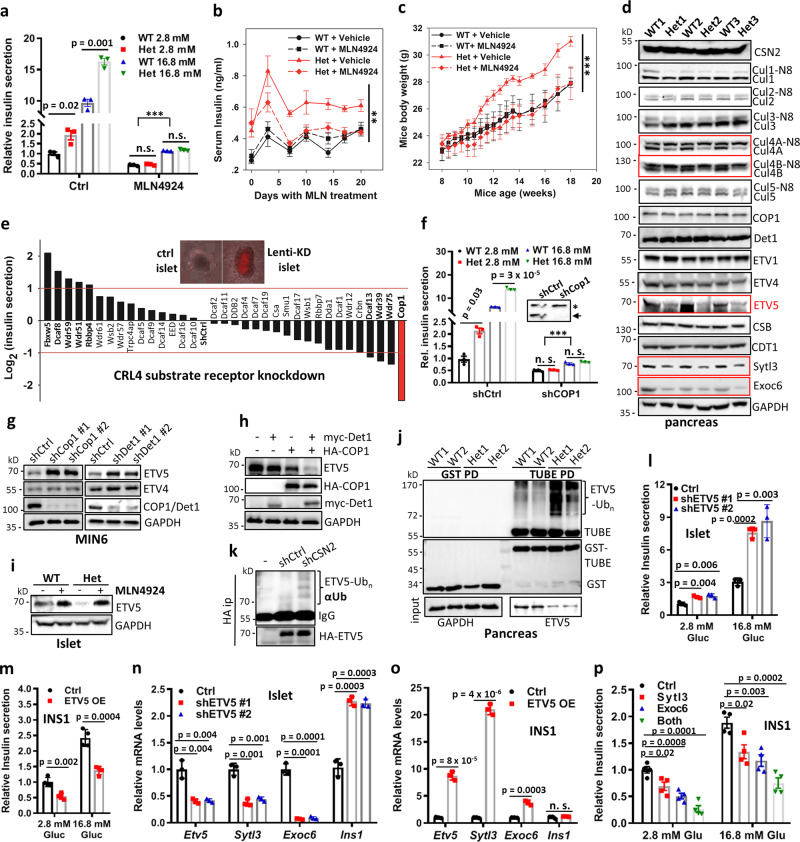
Fig. 3. Activation of the CRL4COP1–ETV5 degradation axis underlies glucose-induced insulin secretion and is constitutively augmented in Csn2WT/K70E (Het) mice.
a Effect of MLN4924 treatment (2 μM, 2 h) on basal and glucose-stimulated insulin secretion by wild-type and Csn2WT/K70E islets (n = 6, ***p < 0.001, calculated by two-way ANOVA testing the effect of 2.8 or 16.8 mM glucose in the presence of MLN4924, the other p values were calculated by two-tailed Student’s t test). Data are presented as mean ± SEM. b, c Mice serum insulin levels with/without MLN4924 treatment (15 mg/kg, twice weekly for 6 weeks). Insulin levels were measured at the same time of the day to minimize fluctuation. (n = 6, **p = 0.001, calculated by two-way repeated measures ANOVA testing genotype × time effect for Het mice). Data are presented as mean ± SEM. c Mice body weight with/without MLN4924 treatment (15 mg/kg, twice weekly for 6 weeks; n = 6, ***p < 0.001, calculated by two-way repeated measures ANOVA testing genotype × time effect for Het mice). Data are presented as mean ± SEM. d Levels of total and neddylated Cullins, COP1, and CRL4 substrates in the pancreas after 6 h fasting to normalize variation in blood glucose levels. e Ex vivo, lentiviral shRNA-based knockdown screening for CRL4 adaptors whose depletion alters islet insulin secretion. Quantified values of insulin secretion were normalize by that of Ctrl islets and presented in Log2 scale. f Effect of adenovirus-mediated in-islet COP1 knockdown on basal and glucose-stimulated insulin secretion (n = 3, ***p < 0.001, calculated by two-way ANOVA testing the effect of 2.8/16.8 mM glucose in the presence of shCOP1, the other p values were calculated by two-tailed Student’s t test). Data are presented as mean ± SEM. Inset: western blot showing efficient COP1 knockdown. Arrow indicates COP1 band. An asterisk (*) indicates nonspecific band. g Levels of ETV4 and ETV5 in MIN6 cells with COP1 (left) or Det1 (right) knockdown using two independent shRNA. h Levels of ETV5 in MIN6 cells with Myc-Det1 and HA-COP1 single or double overexpression. i Levels of ETV5 in wild-type and Csn2WT/K70E islets with/without MLN4924 treatment (2 μM, 2 h). j Levels of ubiquitylated ETV5 enriched by GST-TUBE pulldown. k Effect of CSN2 knockdown on ETV5 ubiquitylation in MIN6 cells. l Effect of adenovirus-mediated in-islet ETV5 knockdown on insulin secretion (n = 3). Data are presented as mean ± SD. P values were calculated by two-tailed Student’s t test. m Effect of ETV5 overexpression on insulin secretion (n = 4). Data are presented as mean ± SD. P values were calculated by two-tailed Student’s t test. n Effect of adenovirus-mediated in-islet ETV5 knockdown on mRNA levels of ETV5 transcriptional targets (n = 3). Data are presented as mean ± SD. P values were calculated by two-tailed Student’s t test. o Effect of ETV5 overexpression on mRNA levels of ETV5 transcriptional targets (n = 3). Data are presented as mean ± SD. P values were calculated by two-tailed Student’s t test. p Effect of Sytl3 and Exoc6 overexpression on insulin secretion (n = 3). Data are presented as mean ± SEM. P values were calculated by two-tailed Student’s t test.

