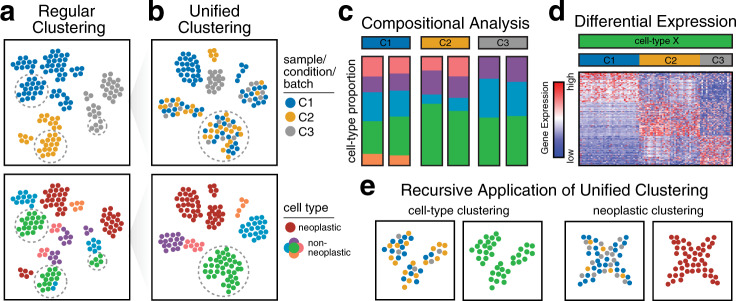
Fig. 3. Unified clustering analysis.
a The clustering of cells from different samples across diverse conditions may result in cells being aggregated by sample, condition, or other technical factors such as the batch rather than the cell types of interest. The top illustration shows a 2D reduced dimensional representation (e.g., tSNE) in which each point is a cell and is colored according to the sample, condition, or batch label. The bottom illustration shows the same 2D embedding colored according to cell type. Cells are aggregated according to the sample, condition, or batch, rather than the cell type, making the identification of shared cell types difficult. b Unified clustering analysis results in cells that are appropriately aggregated by cell type, particularly for nonneoplastic cell types. c After the identification of common cell types, additional downstream analyses may be performed. For example, compositional analysis comparing nonneoplastic cell-type proportions across three conditions, each with two replicates, can be performed to show high correspondence within replicates but differences across conditions. d Differential expression analysis can also be applied to one cell type, comparing each condition to all others, identifying differentially upregulated genes in each condition. e Unified clustering analysis may be applied recursively to identify additional subtypes or states within nonneoplastic cell types (left) or shared transcriptional states among neoplastic cells across patients.

