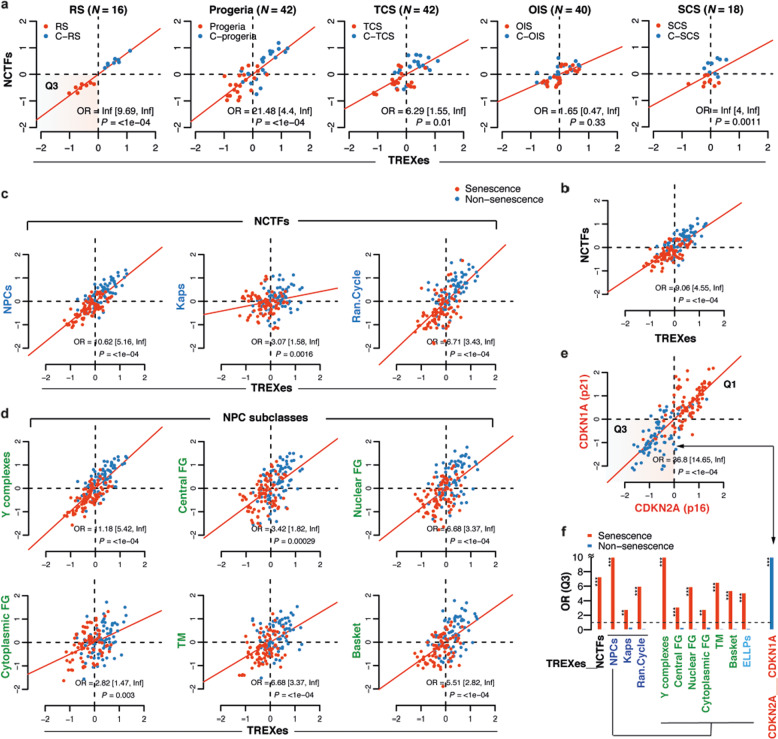
Fig. 1. TREXes and NCTFs show distinctive enrichment patterns in various types of senescent cells.
a Analysis of the two-dimensional differential mean expression of TREXes and NCTFs in five senescent cell types (red dots) of different origins and their young counterparts (blue dots). After gene set mean expressions were z-standardized, the odds ratio (OR) and statistical significance were calculated by Fisher 2-tailed exact test. Horizontal and vertical dashed lines are median points for TREXes and NCTFs. Senescent cells were more likely to be in the lower left-hand quadrant (Q3), and the odds ratios are shown with 95% confidence intervals and p-values. b–d Panel b through d are compilations of the data on five senescence types showing the enrichment patterns of TREXes and NCTFs. b TREXes and NCTFs in all five types of senescent cells. c TREXes and subclasses of NCTFs: NPCs, Kaps, and Ran cycle. d TREXes and six distinct subclasses of NPC: Y complexes, central FG, nuclear FG, cytoplasmic FG, TM, and basket. e Two-dimensional differential mean expression of CDKN2A (p16) and CDKN1A (p21), well-known senescence markers, in all senescent cell types. f Bar plot representing the odds ratios (Q3) of the NCTFs, their subclasses, and TREXes as shown in (b) through (e). The red bar indicates the odds ratio (Q3) of the senescent cells, and the blue bar indicates the odds ratio of the nonsenescent cells. The color legends on the x-axis, i.e., black, blue, green, and red, represent (b–e), respectively. RS replicative senescence, TCS tumor cell senescence, OIS oncogene-induced senescence, SCS stem cell senescence, Kaps karyopherins, FG phenylalanine–glycine repeat, TM transmembrane.

