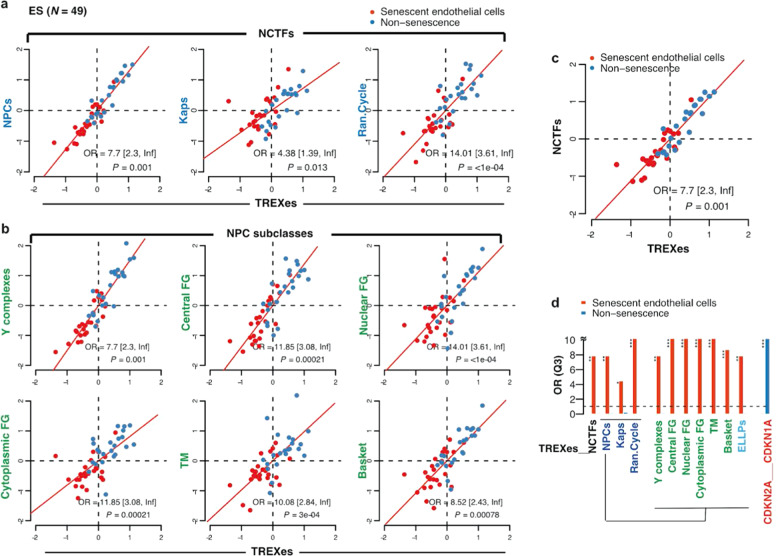
Fig. 2. TREXes and NCTFs show distinctive enrichment patterns in endothelial senescent cells.
Analysis of two-dimensional differential mean expression of TREXes and NCTFs between endothelial senescent cells (red dots) from 8 screened endothelial aging studies and their young counterparts (blue dots). After gene set mean expression levels were z-standardized, the odds ratio (OR) and statistical significance were calculated by Fisher 2-tailed exact test. Horizontal and vertical dashed lines are median points for the TREXes and NCTFs. Endothelial senescent cells were more likely to be in the lower left-hand quadrant (Q3), and the odds ratios are shown with 95% confidence intervals and p-values. a TREXes and subclasses of NCTFs: NPCs, Kaps, and Ran cycle genes. b TREXes and six distinct subclasses of NPC: Y complexes, central FG, nuclear FG, cytoplasmic FG, TM, and basket. c Collective TREXes and NCTFs of endothelial senescent cells. d Bar plot representing the odds ratios (Q3) of NCTFs and subclasses and TREXes, as shown in (a) through (c). The red bar indicates the odds ratio (Q3) of the senescent cells, and the blue bar indicates the odds ratio of the nonsenescent cells. ES endothelial senescence, Kaps karyopherin, FG phenylalanine–glycine repeat, TM transmembrane.

