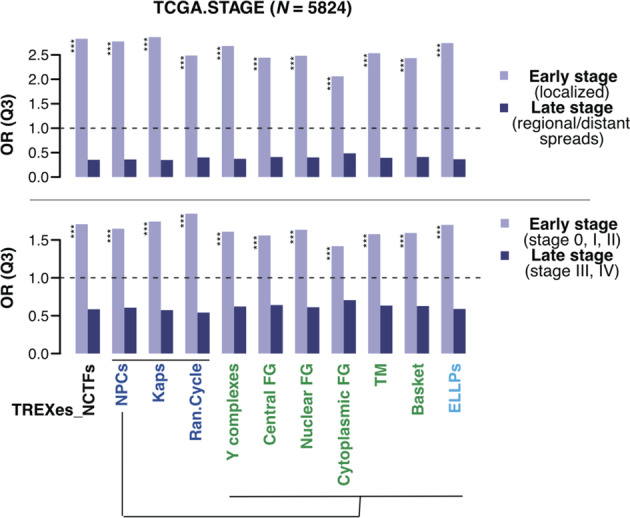
Fig. 5. TREXes and NCTFs show distinctive enrichment patterns by cancer stage.

Comparison of the odds ratios of TREXes and NCTF subclasses in early- and late-stage cancers, as obtained from the GTEx database. Bar plot representing the odds ratios (ORs, Q3) of the NCTFs or their subclasses and TREXes. The light violet bar indicates the ORs in the early-stage cancer tissue, and the dark violet bar indicates thee ORs in the late-stage cancer tissue. Color legends on the x-axis are the same as those shown in Fig. 1e. Higher ORs indicate a greater likelihood of data being in Q3.
