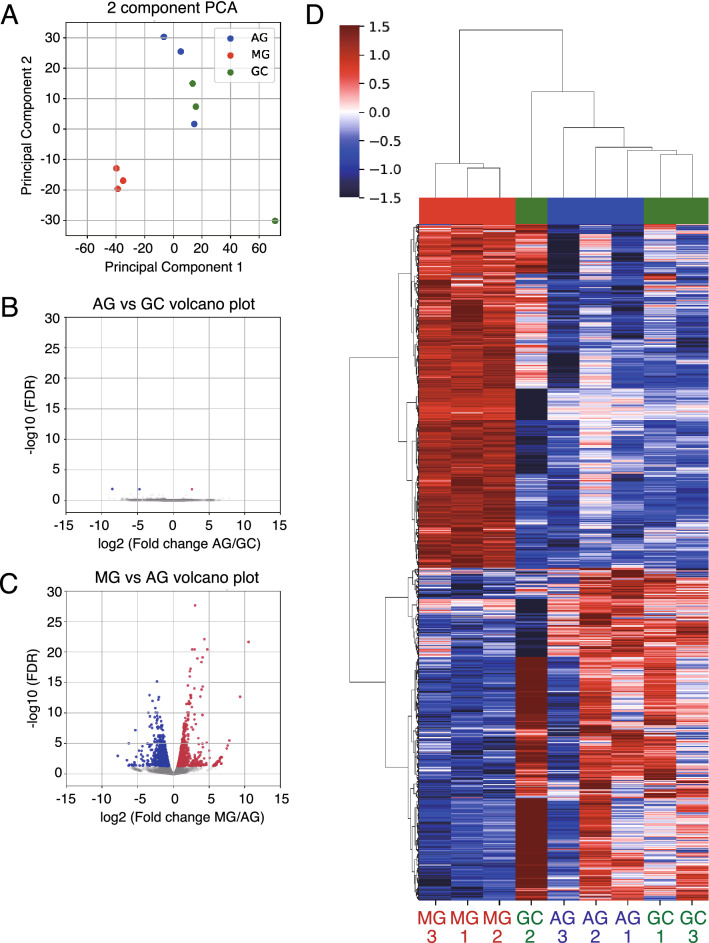
Figure 2.
Gene expression profiling in the soleus muscle of GC, AG, and MG. (A) PCA of DEGs in at least one comparison among the soleus muscle of GC (n = 3; green), AG (n = 3; blue), and MG (n = 3; red). (B, C) Volcano plots showing DEGs in the soleus muscle of AG and GC (B), and MG and AG (C). (D) Heat map and hierarchical clustering of the gene expression data in the soleus muscle of GC, AG, and MG showing 1,720 DEGs in AG and MG.

