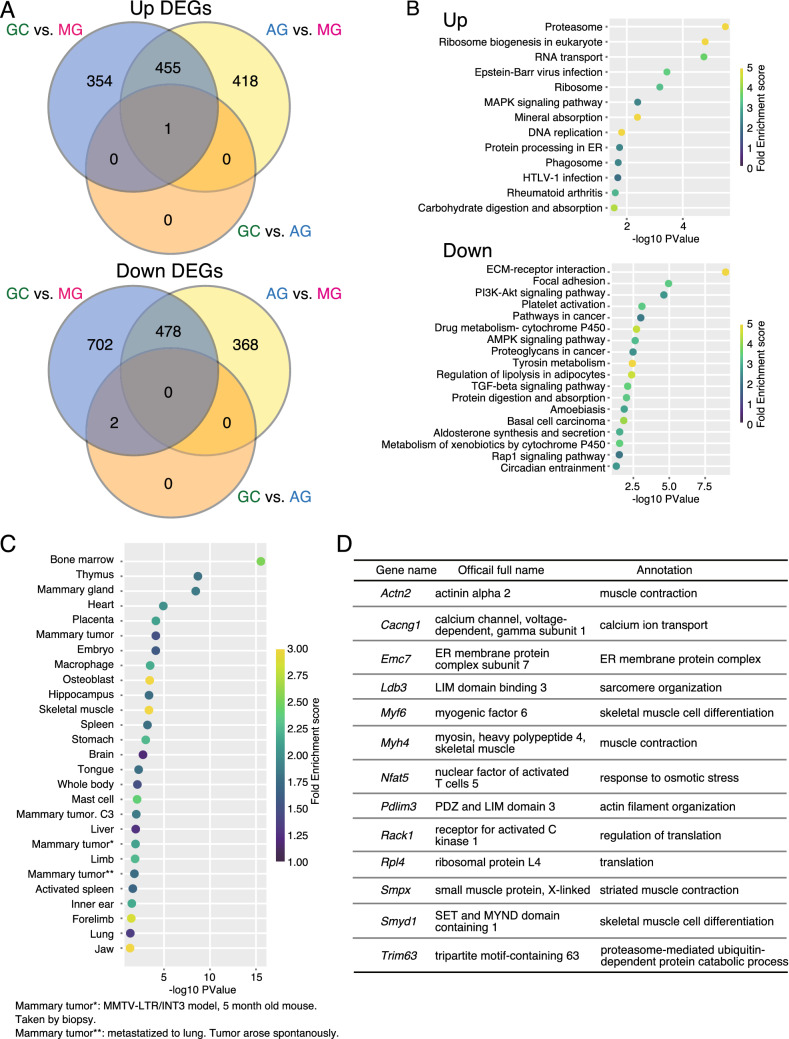
Figure 4.
Pathway analysis of changed genes between MG and GC, and MG and AG, and identifying novel candidate genes involved in muscle atrophy. (A) Venn diagram showing the number of upregulated (upper) and downregulated (lower) DEGs in each comparison between MG, GC, and AG. (B) Pathway analysis of upregulated (upper) and downregulated (lower) DEGs in the overlapping region of MG compared with GC and AG. (C) Tissue expression profiles of 418 upregulated DEGs in MG compared with AG. (D) The gene list showing skeletal muscle-related genes from Fig. 4C.

