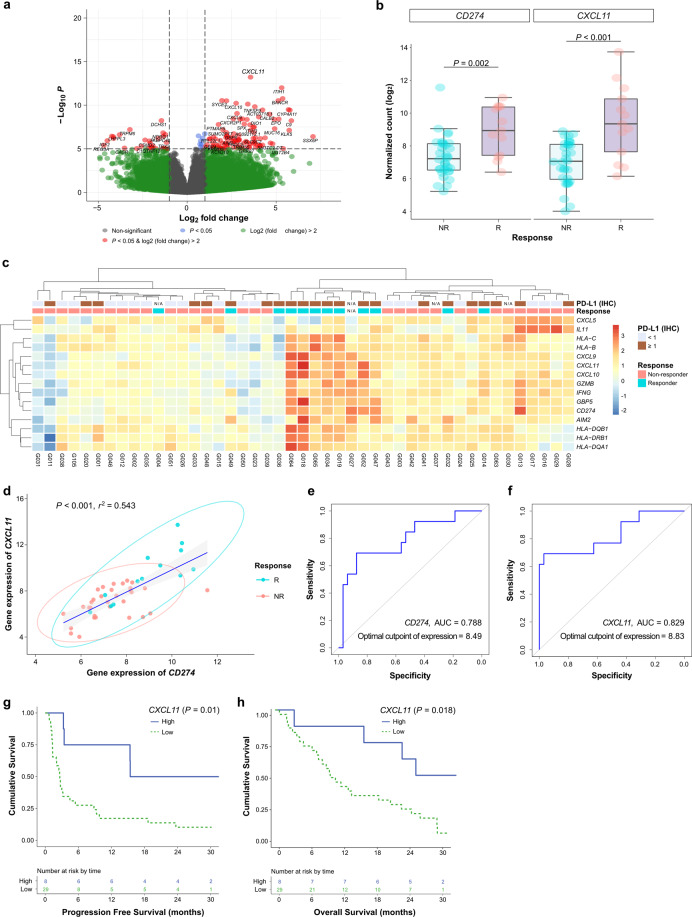
Fig. 2. Analysis of differentially expressed genes (DEGs) in RNA sequencing data related to the ICI treatment response.
a Volcano plot showing DEGs based on the response to ICIs with log2 (fold change in expression) >2 and P < 0.05. b Boxplot of gene expression values (DESEQ2) of CD274 and CXCL11 based on the ICI response. c Heatmap of representatively significant immune-related genes in the analysis of DEGs. d Correlation of the gene expression of CXCL11 and CD274. e Predictive value and optimal cutoff value of the CD274 gene for responsiveness using the ROC curve. f Predictive value and optimal cutoff value of the CXCL11 gene using the ROC curve. g Progression-free survival using the split level by the optimal cutoff point of CXCL11 for responsiveness using the ROC curve. h Overall survival using the split level by the optimal cutoff value of CXCL11 for responsiveness using the ROC curve. R, responder; NR, nonresponder; IHC, immunohistochemistry; ICI, immune checkpoint inhibitor; ROC, receiver operating characteristic; N/A, not available.

