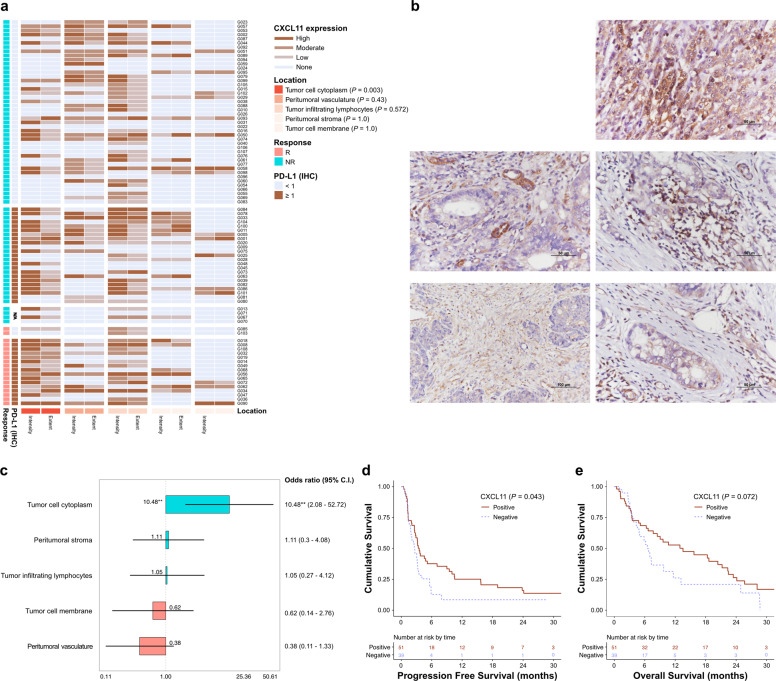
Fig. 3. Evaluation of ICI treatment responsiveness based on immunohistochemical staining for the expression of CXCL11.
a Heatmap with intensity and extent depending on the location of the expression of CXCL11. b Representative photomicrographs showing the expression of CXCL11 in gastric cancer tissue. Expression in the tumor cell cytoplasm (top; original magnification ×400), peritumoral vasculature (top, left; original magnification ×400), tumor-infiltrating lymphocytes (middle, right; original magnification ×400), peritumoral stroma (bottom, left; original magnification ×200), and tumor cell membrane (bottom, right; original magnification ×400). c Forest plot of the odds ratio of the expression location of CXCL11. d Progression-free survival using the expression of CXCL11. e Overall survival using the expression of CXCL11. R, responder; NR, nonresponder; ICI, immune checkpoint inhibitor; IHC, immunohistochemistry; CPS, combined positive score; N/A, not available. *P < 0.05 and **P < 0.01, as determined by multivariate logistic regression analysis.

