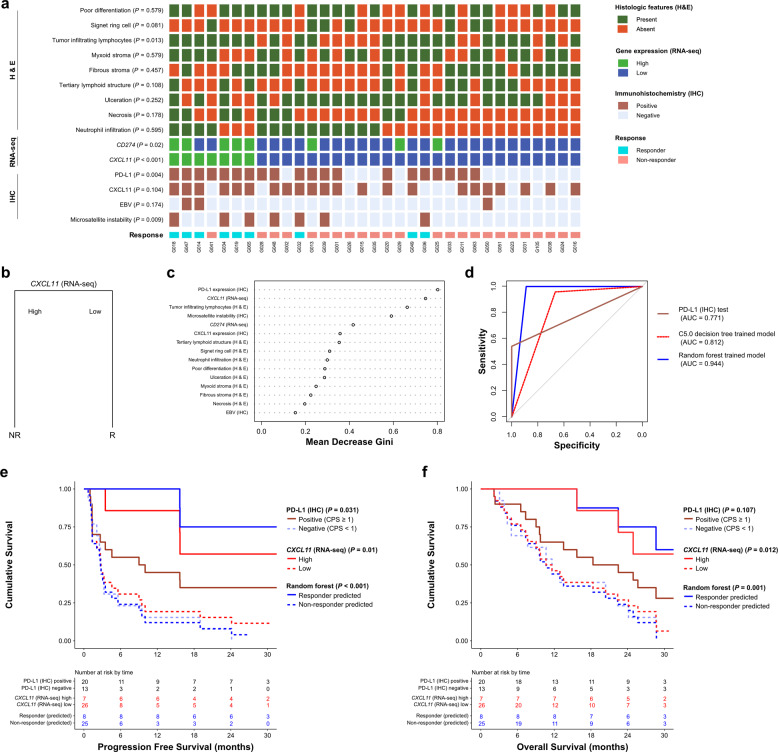
Fig. 4. ICI responsiveness prediction model trained with integrated data and performance evaluation.
a Heatmap showing the result of integrating all results from histological, RNA-seq, and IHC analyses to train the predictive model. Patients with missing data were removed. b The predictive model trained using the C5.0 decision tree model. The categorical level of the CXCL11 (RNA-seq) single variable was trained as an optimal model. c The mean decrease in Gini of the predictive model trained using the random forest model. d Comparative ROC curve showing the AUC of the performance of the trained model in b and c. e, f Comparative analysis of the survival rate between the predicted responsiveness using the trained models and the PD-L1 (IHC) test. e Progression-free survival. f Overall survival. R, responder; NR, nonresponder; ICI, immune checkpoint inhibitor; H/E, hematoxylin and eosin; IHC, immunohistochemistry; ROC, receiver operating characteristic; AUC, area under the curve; RNA-seq, RNA sequencing.

