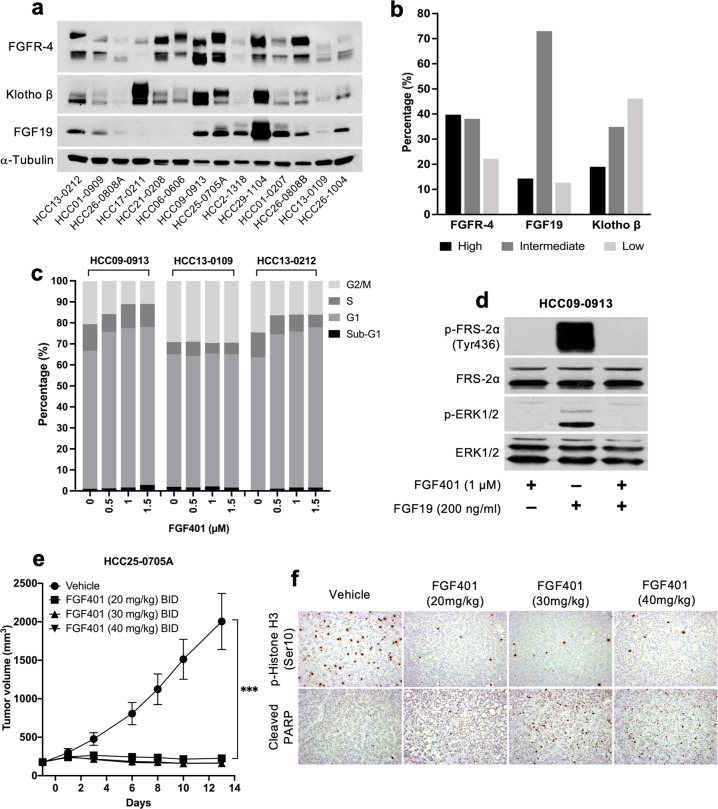
Fig. 1. FGFR-4, FGF19, and Klotho-β expression and the effects of FGF401 in vitro and in vivo.
Representative blots of FGFR-4, FGF19, and Klotho-β in 14 of 63 established HCC models are shown (a) and were classified as high, intermediate, or low (b). Cells were treated with FGF401 and subjected to cell cycle analysis (c). HCC09-0913 cells were pretreated with vehicle or FGF401 and then stimulated with FGF19 (d). Mice were orally administered FGF401 twice daily. Mean tumor volumes ± SE are plotted (*p < 0.01; Student’s t test) (e). Tumor sections were stained for p-Histone H3 Ser10 and cleaved PARP (f).

