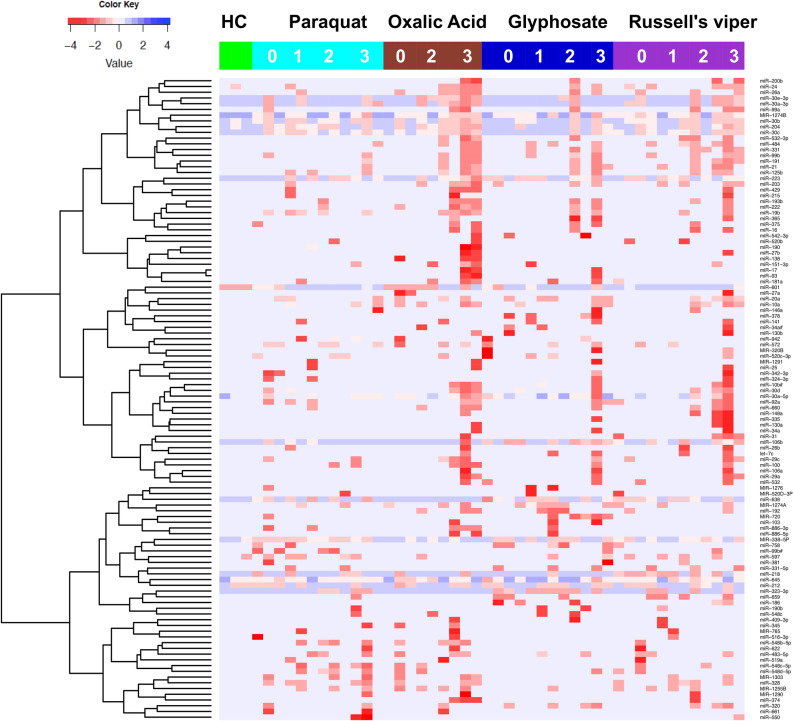
Figure 1.
Urinary microRNAs detect AKI after different causes of poisoning. Supervised hierarchical clustering heat map of differentially expressed microRNAs (n=112) distinguished patients with severe AKI from NOAKI and healthy controls. Green, cyan, maroon, dark blue and purple indicates healthy controls, paraquat, Glyphosate, Oxalic acid and Russell’s viper bite respectively. AKI stages are numbered as 0, 1, 2 and 3 for NOAKI, AKIN1, AKIN2 and AKIN3 respectivly. Rows represent microRNAs (normalised Ct) and columns represent the individual samples from healthy controls and patients.

