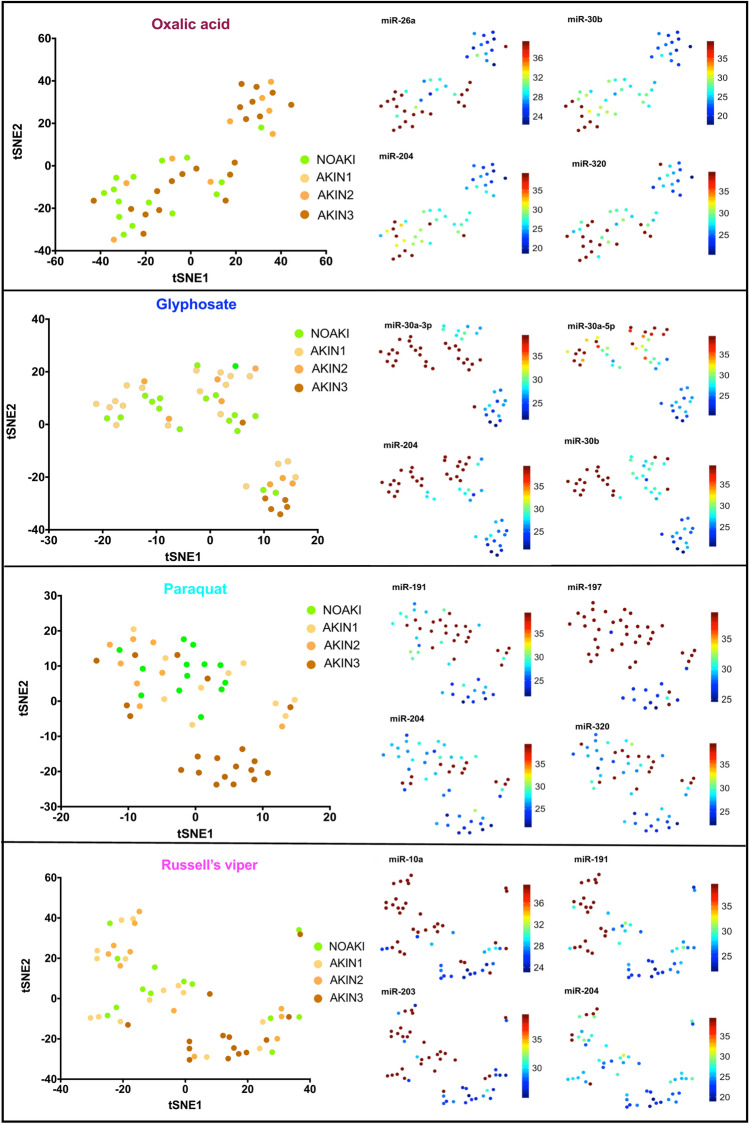
Figure 2.
tSNE plots show the clusters of individual microRNAs with NOAKI, AKIN1, AKIN2 and AKIN3 caused by different poisons. Left panels show plots of the non-linear tSNE map of samples in validation cohort using each specific set of differentially expressed microRNAs for different poisons (oxalic acid, glyphosate, paraquat) and Russell’s viper bite, (Supplementary Table 3). Plots were generated using 4-dimensional principal component space into two dimensions showing tSNE analysis. Each point represents a single sample. The right panel shows the expression of the top four most significantly altered microRNAs for each poison presented as individual tSNE-projections. Blue to red presented in the color bar indicate high to low microRNA expression (data shown in normalized Ct values, therefore a lower value represents a higher expression) respectively.

