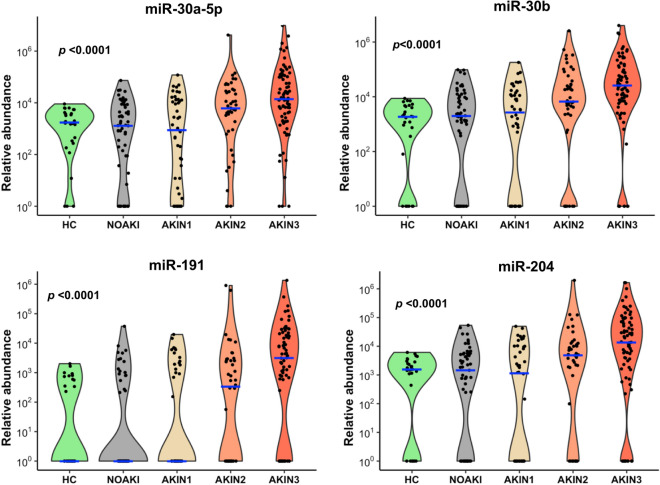
Figure 4.
Top four microRNAs associated with AKI for all toxic agents. Violin plots show these microRNAs having increased abundance with increasing AKI severity in all four toxins. Blue lines indicate the medians and each black dot presents a different sample from validation cohort. The y-axis is relative abundance from the detectable limit (2(39-Ct), Ct of 39 is the threshold of detectability). MicroRNA expressions were normalised using two spike control ath-microRNAs (ath-miR-159a and ath-miR-172a). p is the alternative p value from Jonckheere–Terpstra nonparametric ordered test.

