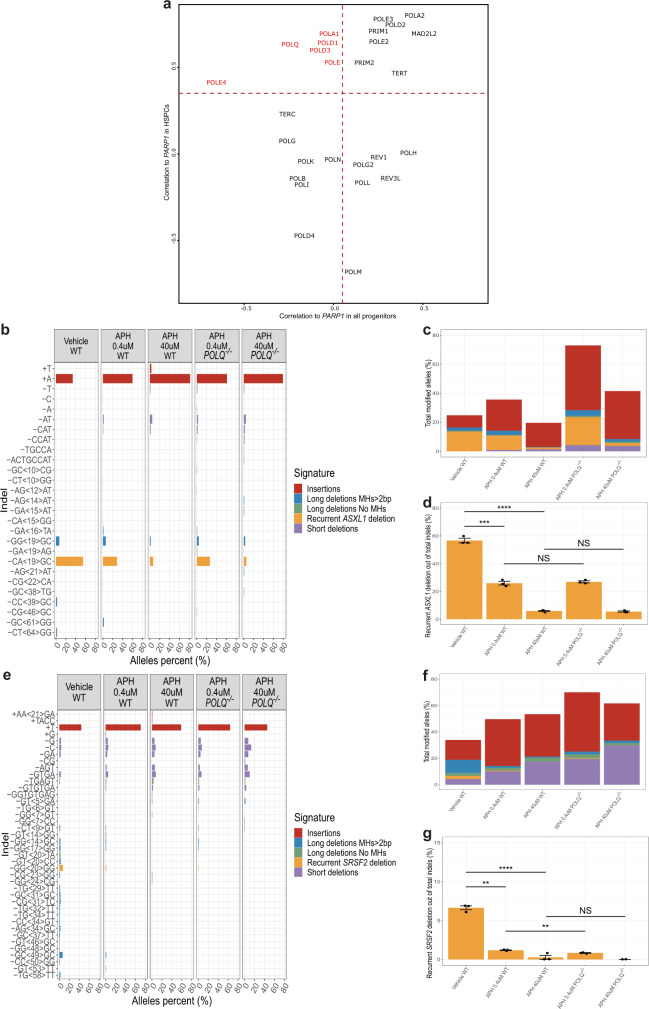
Fig. 7. Aphidicolin treatment reduces the formation of preL-MMEJ deletions.
a Scatter plot of Pearson correlations between PARP1 and various DNA polymerase genes normalized expression, compared when calculated for all the progenitors metacells in the bone-marrow CD34 + data (X-axis) and specifically for hematopoietic stem and progenitor cells (HSPCs) metacells (Y-axis). Red gene names show DNA polymerases with significant correlation in HSPCs but negligible or negative correlation across all progenitors. b, e Indel sequences and percentage of ASXL1 (b) and SRSF2 (e) modified alleles among the total indel alleles as assessed by deep targeted sequencing (read depth 5000X) in K562 cells following the induction of DSBs in ASXL1 (b) or SRSF2 (e) loci. Wild type (WT) or POLQ −/− K562 cells that were electroporated in the presence of the DMSO vehicle (only WT), 0.4 or 40 uM aphidicolin (APH) are shown. In e, allele percent of 0.5% and above are shown. c, f Overall modification frequency as assessed by deep targeted sequencing (read depth 5000X) in K562 cells following the induction of DSBs in ASXL1 (c) or SRSF2 (f) loci. WT or POLQ −/− K562 cells that were electroporated in the presence of the DMSO vehicle (only WT), 0.4 or 40 uM aphidicolin (APH) are shown. d, g Percentage of the recurrent MH-based deletions among the total indel alleles following the induction of DSBs in ASXL1 (d) or SRSF2 (g) loci. WT or POLQ −/− K562 cells that were electroporated in the presence of the DMSO vehicle (only WT), 0.4 or 40 μM aphidicolin (APH) are shown. Data are presented as mean values ± SEM. n = 3 biologically independent samples. Unpaired two tailed T-test was used to determine statistical significance. (NS, nonsignificant, **P < 0.01, ***P < 0.001, and ****P < 0.0001). d Vehicle WT vs. APH 0.4 μM WT p = 0.00013, vehicle WT vs. APH 40 μM WT p = 7.89e-06, APH 0.4 μM WT vs. APH 0.4 μM POLQ −/− p = 0.5763, APH 40 μM WT vs. APH 40 μM POLQ −/− p = 0.5761. g Vehicle WT vs. APH 0.4 μM WT p = 0.0017, vehicle WT vs. APH 40 uM WT p = 6.3e-05, APH 0.4 μM WT vs. APH 0.4 μM POLQ −/− p = 0.0041, APH 40 μM WT vs. APH 40 μM POLQ −/− p = 0.42. Indel signatures are: Insertions (red) ≥5-bp deletion with flanking microhomologies (MHs) of at least 2 bp (blue), ≥5-bp deletion with flanking MHs of zero or 1 bp (green), short deletion (<5-bp) (purple) and the recurrent deletions in ASXL1 (b, c, d) SRSF2 (e, f, g) genes (orange). Source data are provided as a Source Data file.

