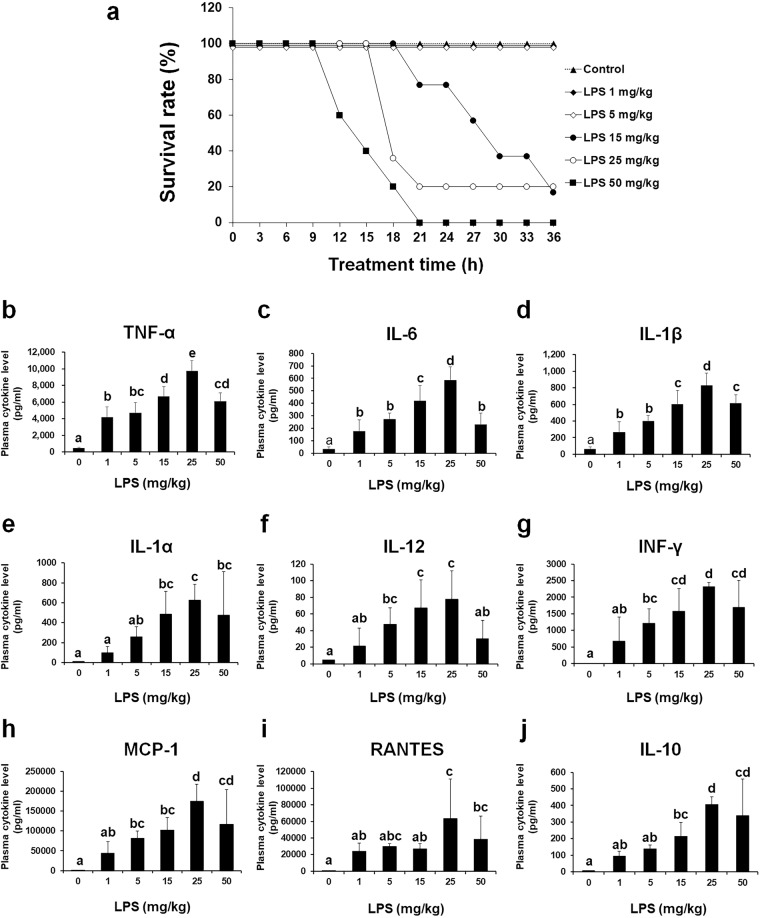
Fig. 1. Survival rates and plasma cytokine levels in mice with LPS-induced endotoxemia.
C57BL/6 mice were injected i.p. with 1–50 mg/kg LPS dissolved in saline. Mice in the control group were injected with the same volume of saline. a Survival in each group was monitored at 3-h intervals (n = 5). b–j Cytokine concentrations in plasma collected from mice were measured using a magnetic Luminex assay. The data are presented as the mean ± standard deviation values (n = 7). Differences among experimental groups were analyzed using one-way ANOVA with Duncan’s multiple range test. The different letters indicate significant differences (*P < 0.05).

