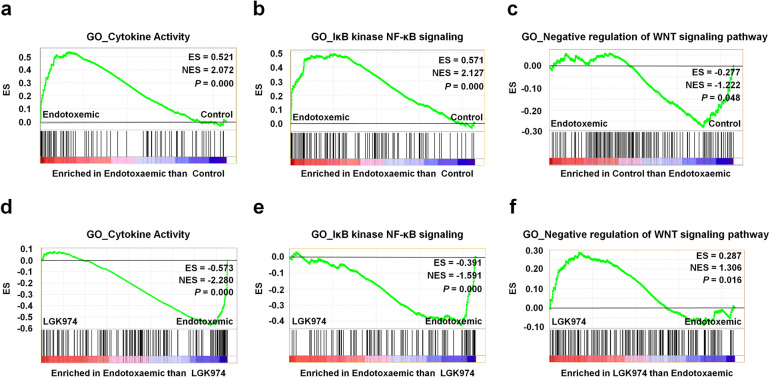
Fig. 3. Gene set enrichment analysis (GSEA) of RNA-seq data from liver tissues of endotoxemic mice.
RNA was isolated from the liver tissues of mice injected with saline (control group), 25 mg/kg LPS (endotoxemic group), or 60 mg/kg LGK974 and 25 mg/kg LPS (LGK974 group). a–c GSEA showing an overrepresentation of the GO term “cytokine activity” (a), the overrepresentation of the GO term “IκB kinase NF-κB signaling” (b), and underrepresentation of the GO term “negative regulation of Wnt signaling pathway” (c) in the endotoxemic group compared with the control group. d–f GSEA showing underrepresentation of the GO term “cytokine activity” (d), underrepresentation of the GO term “IκB kinase NF-κB signaling” (e), and overrepresentation of the GO term “negative regulation of Wnt signaling pathway” (f) in the LGK974 group compared with the endotoxemic group. The plot shows the running ES for the gene set as the analysis proceeded. The score at the peak of the plot (furthest from 0.0) is the ES for the gene set. ES enrichment score, NES normalized enrichment score.

