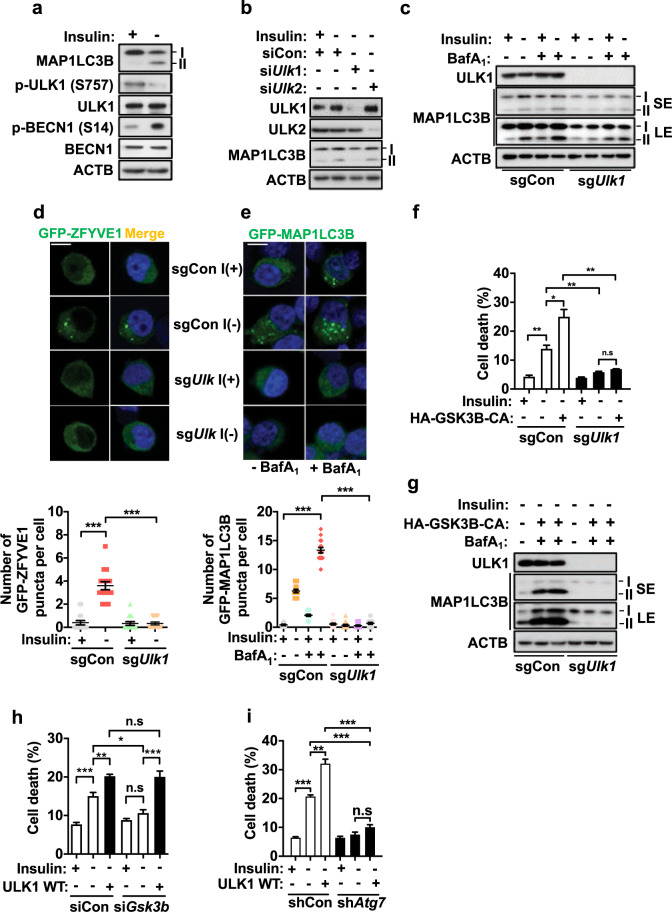
Fig. 1. ULK1 regulates autophagy induction in HCN cells.
a Western blotting analysis of ULK1 activation in HCN cells after insulin withdrawal for 6 h. The total and phosphorylated bands were detected in two different gels with the same lysates. b Western blotting analysis of the effects of ULK1 and ULK2 knockdown on MAP1LC3B lipidation in HCN cells after insulin withdrawal for 6 h. c Western blotting analysis of autophagy flux in Ulk1 KO (sgUlk1) and control (sgCon) HCN cells after insulin withdrawal for 6 h. Bafilomycin A1 (BafA1, 20 nM) was added 2 h before cell harvest. d, e Representative images of d GFP-ZFYE1 (n = 30) and e GFP-MAP1LC3B (n = 30) puncta in sgUlk1 HCN cells. Scale bar, 10 μm. The nuclei were counterstained with Hoechst 33342 (blue) after insulin withdrawal for 6 h. f Measurement of cell death in HCN cells transfected with HA-GSK3B-CA after insulin withdrawal for 24 h (n = 3). g Effect of GSK3B-CA overexpression on autophagy flux in sgUlk1 cells. Autophagy flux was analyzed by western blotting after insulin withdrawal for 6 h. h, i Measurement of cell death in h siGsk3b (n = 5) and i shAtg7 (n = 3) HCN cells after ULK1 WT overexpression. Cell death was measured after insulin withdrawal for 24 h. SE short exposure; LE long exposure. *P < 0.05, **P < 0.01, and ***P < 0.001. ns not significant.

