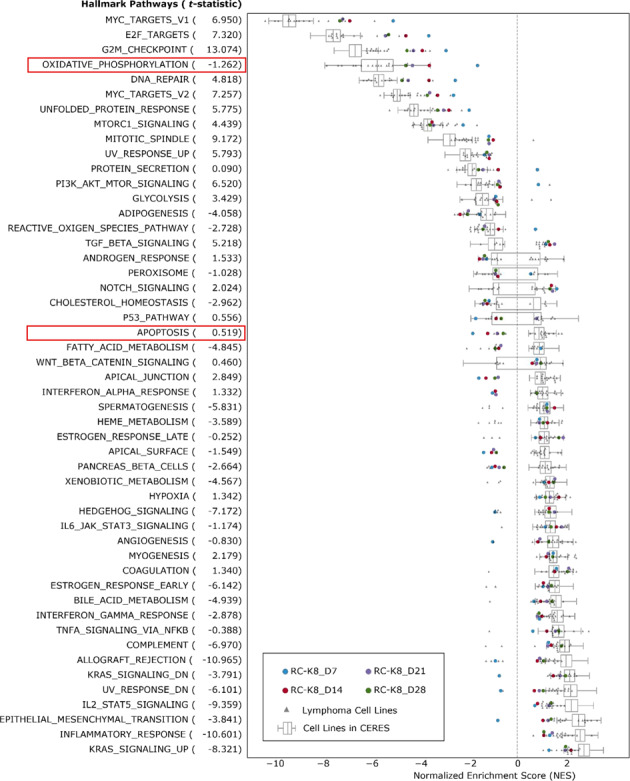
Fig. 4. Gene set enrichment analysis (GSEA) of 50 hallmark pathways.

Normalized gene enrichment scores based on RC-K8 screening results (CRISPR scores) at four time points (coloured dots) compared to enrichment scores based on previously reported screens from B-cell lymphoma cell lines (grey triangles) and 341 cancer cell lines from the CERES data (box plot). Pathways are sorted by median enrichment scores of all cell lines. T-statistics were calculated by comparing the enrichment scores between lymphoma cell lines and CERES cell lines, indicating the specificity of enrichments towards B-cell lymphoma.
