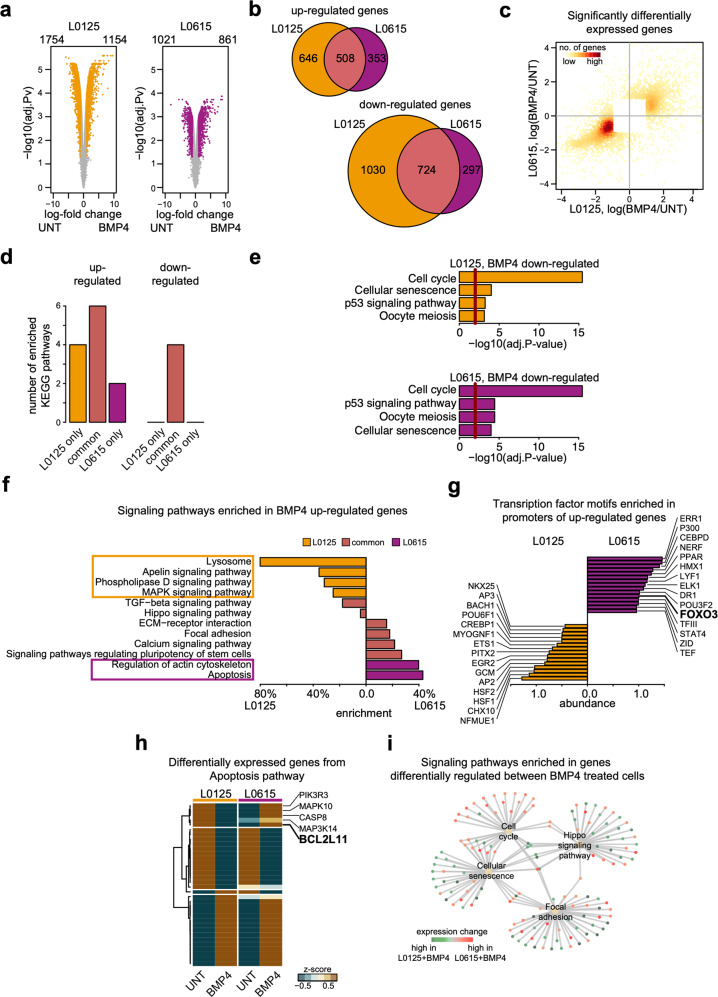
Fig. 3. Global transcriptomic analysis reveals that apoptotic signaling differs in EGFRlow and EGFRhigh cells after BMP4 treatment.
a Comparison of gene expression profiles between untreated (two replicates) and BMP4-treated (two replicates) cells. The left and right panels correspond to L0125 and L0615 glioma spheres. Each point on the plots corresponds to one gene. The X-axis shows the expression ratio (BMP4/UNT, log-scale). The Y-axis presents the corresponding adjusted P-values computed with DESeq, -log10 (adj. P-value). The Benjamini and Hochberg method was applied for the P-value adjustment. Genes whose expression levels were significantly altered (adj. P-value<0.05 and |log fold change | >2) are marked with colors – yellow for L0125 cells and purple for L0615 cells. The numbers of genes significantly down- or upregulated are written above the plots. b Venn diagrams summarizing the overlap between differentially up- (top) and downregulated (bottom) genes in the two different cell lines. Yellow and purple circles represent L0125 and L0625 cell lines, respectively. c Scatter plot comparing gene expression changes of significantly differentially expressed genes after BMP4 treatment. Each point on the plot corresponds to one gene. Only genes differentially expressed in at least one cell line are plotted. The X-axis and Y-axis correspond to expression changes in the L0125 and L0615 cell lines, respectively. The color magnitude represents the density of points. d Number of KEGG signaling pathways significantly enriched in the sets of differentially downregulated or upregulated genes. The bars on the left correspond to sets of upregulated genes, while the bars on the right correspond to sets of downregulated genes. Yellow and purple bars depict results specific for the L0125 and L0615 cell lines, respectively. Light purple bars (second and fifth from the left) show a number of nonspecifically enriched pathways. e All KEGG pathways enriched in sets of genes significantly downregulated after BMP4 treatment. The top and bottom panels correspond to the L0125 and L0615 cell lines, respectively. X-axes on both plots represent Benjamini and Hochberg adjusted P-values. The red lines mark P-values = 0.05. f Significantly enriched signaling pathways in sets of upregulated genes upon BMP4 treatment. Yellow and purple bars depict results specific for the L0125 and L0615 cell lines, respectively. Names of pathways specifically enriched for either L0125 or L0615 cells are marked with rectangles. The bars represent relative enrichment (see methods for details). Signaling pathway definitions were obtained from the KEGG database. g Top transcription factors for which binding motifs in promoters of BMP4 upregulated genes were identified. Yellow and purple bars indicate the results for the L0125 and L0615 cell lines, respectively. The lengths of the bars represent log-odds difference of computed scores for the analyzed motifs. The analysis was performed using the Molecular Signatures Database. h A heatmap represents average expression changes of genes involved in apoptosis and differentially expressed after BMP4 treatment in at least one cell line. The z-scores were computed separately for the two cell lines and used to compute the average values (two replicates per average). The first two columns (from the left) correspond to the L0125 line, and the last two correspond to the L0615 line. The rows were clustered using an unsupervised method. i Networks visualizing signaling pathways enriched in a set of genes differentially regulated between BMP4-treated L0125 and L0615 cell lines. The pale yellow points depict identified pathways. Green and red dots represent genes with significantly higher expression levels in L0125 + BMP4 and L0615 + BMP4 cells, respectively. The gray lines represent genes that are members of a particular pathway.

