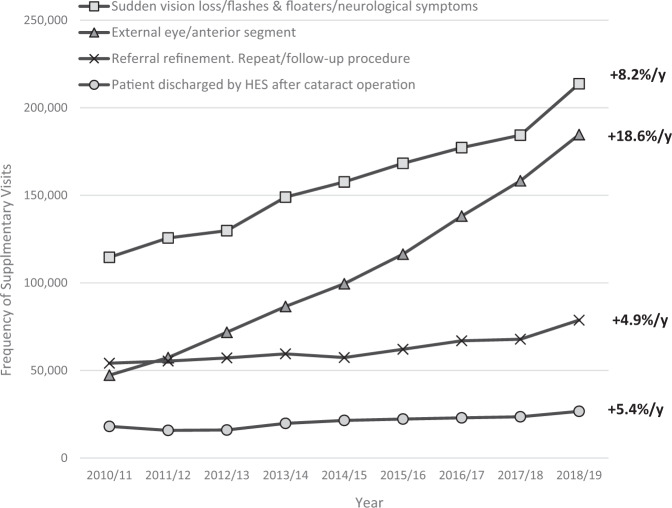
Fig. 2. Graph illustrating the four commonest recorded reasons for supplementary visits since 2010.
Anterior segment presentations and sudden visual loss/flashes and floaters/neurological symptoms represent 68.7% of all supplementary examinations in 2018/2019. Average annual increase is shown on the right. Other recorded reasons for supplementary visits have been excluded as they each make up <20,000 visits per year.

