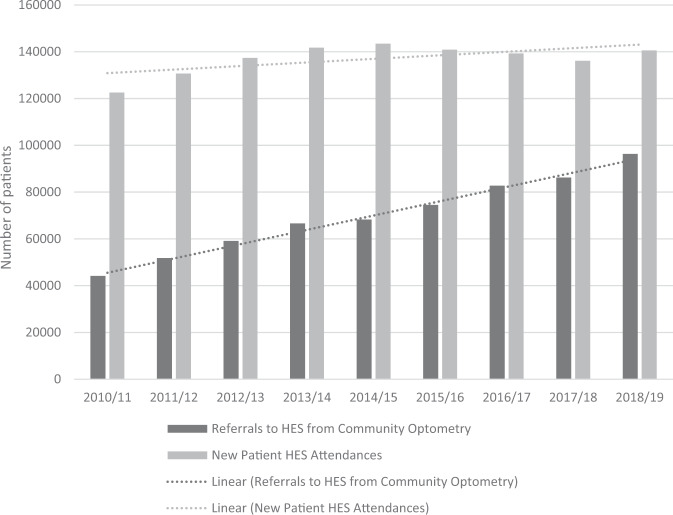
Fig. 5. Graph showing absolute numbers of community optometry referrals to HES and the number of new patient attendances in HES.
The average annual increase in referrals (14.8%) was not mirrored by a similar increase in new patient HES attendances (1.8%). This may be suggestive of a lack of capacity/resources in HES.

