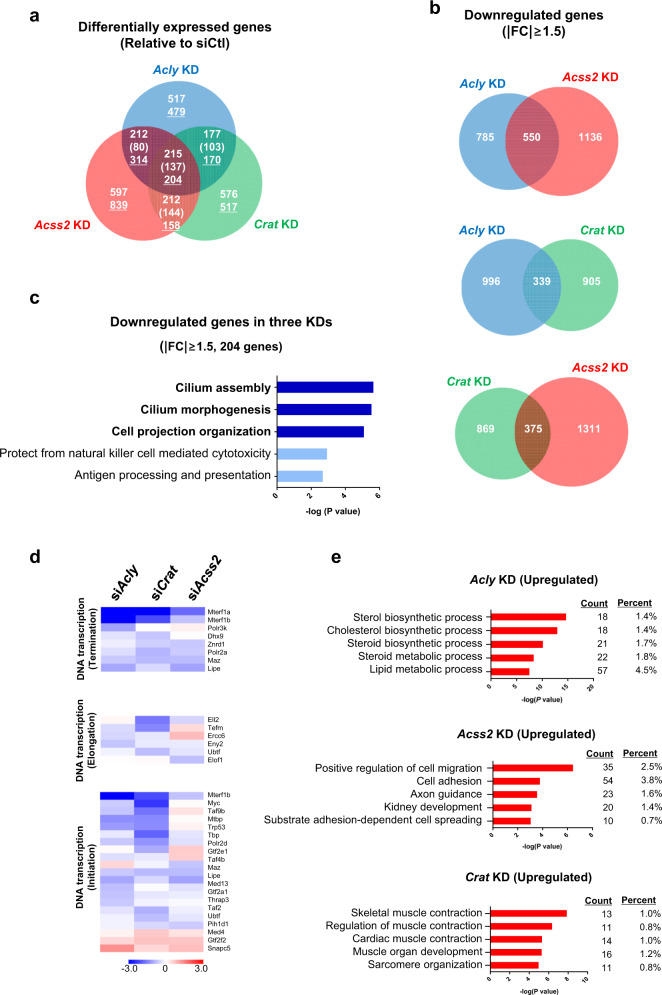
Fig. 5. Transcriptome analysis reveals a cohort of genes sensitive to metabolic perturbation.
a Venn diagram showing differentially expressed genes upon Acly-, Acss2-, or Crat-knockdown in C2C12 myoblasts (relative to the level of siCtl, |FC | ≥ 1.5). Numbers represent the number of commonly upregulated or downregulated (underlined) genes following siRNA treatment. The values in brackets represent gene numbers differently regulated within paired groups. b Venn diagram showing the number of downregulated genes from Acly-, Acss2-, and Crat-knockdown C2C12 myoblasts (relative to the level of the siCtl, |FC | ≥ 1.5). c GO analysis of 204 commonly downregulated genes (|FC | ≥ 1.5). The top 5 biological functions are shown in order of ascending p-values. d Heat map of differentially expressed genes associated with DNA transcription (categorized into initiation, elongation, and termination). e GO analysis of significantly upregulated genes (|FC | ≥ 1.5). The top five biological functions are shown in order of ascending p-value. Each siRNA-mediated knockdown sample was compared with the siCtl.

