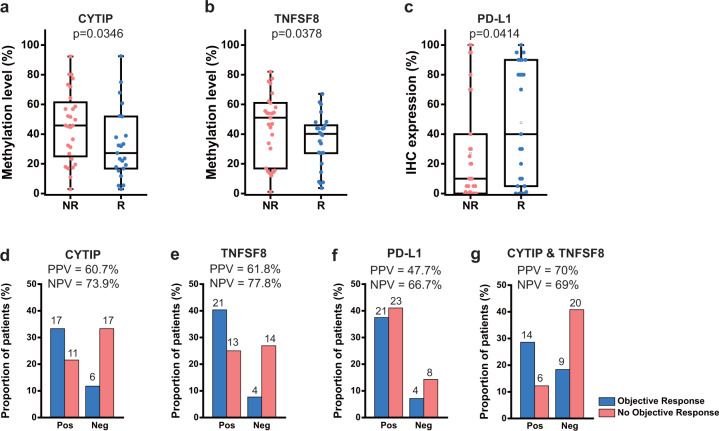
Fig. 4. Evaluation of pDMRs for CYTIP and TNFSF8 to predict the anti-PD-1 response.
a, b Comparison of methylation levels of pDMR for CYTIP between responders (R) and non-responders a and those for TNFSF8 b in the validation cohort. c Comparison of the PD-L1 expression level between responders (R) and non-responders (NR) in the validation cohort. d, e Proportion of patients with objective response (blue) or no objective response (red) to anti-PD-1 therapy for the methylation level threshold of pDMR for CYTIP (40%) or that for TNFSF8 (50%), respectively. “Pos” indicates patients predicted to respond, and “Neg” indicates those predicted to not respond to anti-PD-1 therapy. f Analysis as for d, e with 1% of PD-L1 IHC expression level. g Analysis as for d, e with combined use of pDMRs for CYTIP and TNFSF8.

