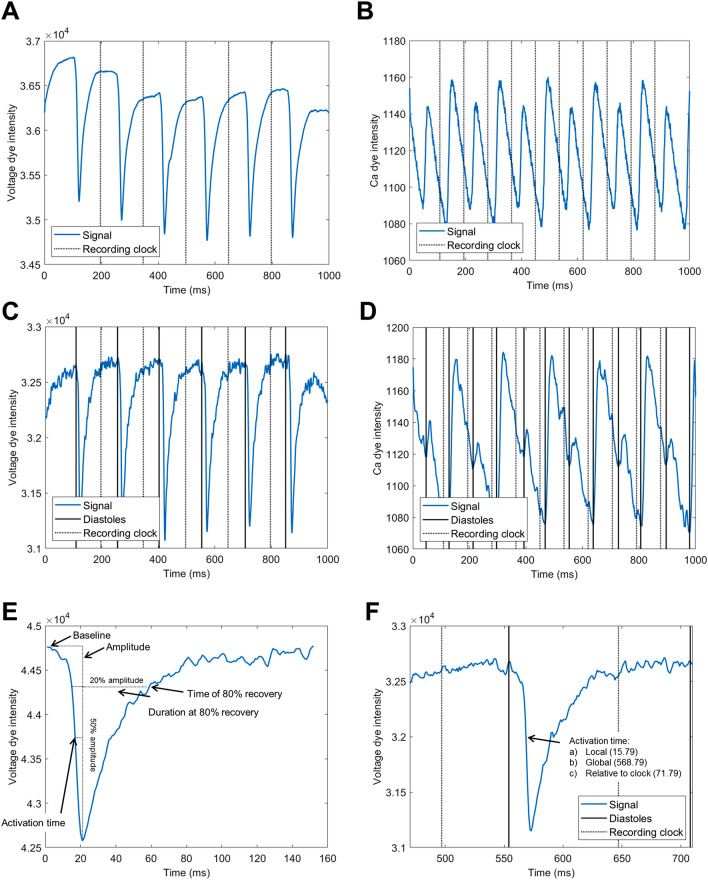
Figure 3.
Illustration of stimulus segmentation and feature extraction. (A) Average trace of a voltage mapping recording in rat heart at 130 ms basic cycle length (the lower the intensity, the higher the membrane potential), showing the recording clock (half-points between peak activations). (B) Average trace of a calcium mapping recording in rat heart at 85 ms basic cycle length (the higher the intensity, the higher the calcium concentration), showing amplitude alternans. (C) Single-pixel trace from the recording used in (A), also showing the points corresponding to the points of smallest activation (“diastoles”, solid black lines), as well as the global clock (dotted black lines). (D) Single-pixel trace from the recording in (B), showing pronounced calcium alternans. This recording illustrates, among other things, that despite baseline subtraction and signal smoothing, no single threshold can be used to satisfactorily segment distinct CaTs, while the comb-based approach of COSMAS correctly identifies CaTs as the intervals between diastoles. (E) Illustrations of features extracted on a single rat AP. (F) Illustration of how activation times are treated. Within single activation, the local activation time is first extracted (15.79 ms after the preceding diastole). This corresponds to the global time (within the whole recording) of 568.79 ms, from which the time of the preceding clock boundary is subtracted, and COSMAS records that the activation came 71.79 ms after the preceding clock. In this way, even though each pixel’s trace may have diastoles detected at different times, all pixels are synchronized to the same global clock, which allows extraction of meaningful activation maps for each pass of a cardiac wave.

