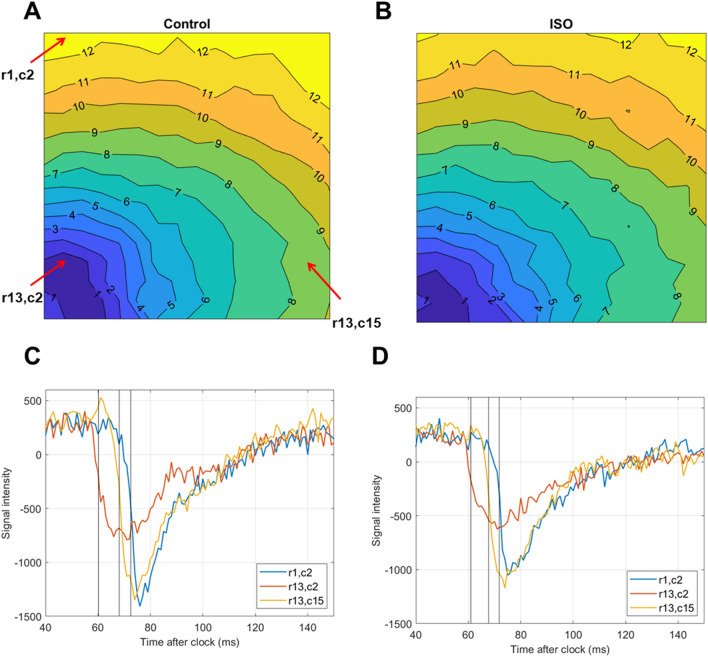
Figure 4.
Activation mapping in a voltage-mapped Langendorff rat heart before and after isoproterenol application. (A) Activation map from a wave pass in control condition; isochronal lines are given in milliseconds, and the map is visualised with a minimum activation time of 0. Spatial resolution is 16 × 16 pixels. Red arrows with annotations highlight pixels from which traces are shown in (C,D), with the arrow labels corresponding to the row and column indices within the activation map. (B) Analogous activation map from a wave pass in the same heart after isoproterenol administration (20 nM). (C) Traces of the three pixels highlighted via the red arrows. The black lines show activation times (points of half-maximum activation) as determined by COSMAS. The time shown on the x axis is taken relative to the preceding clock, and the traces were mean-subtracted on the y axis to facilitate their visualisation in a single plot. (D) Traces of the same three pixels in the map extracted from the heart after isoproterenol administration.

