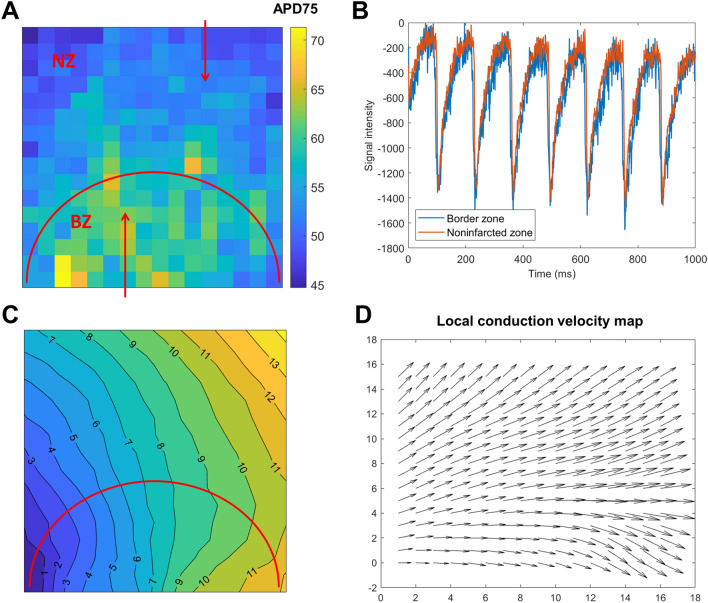
Figure 5.
Spatial heterogeneity in rat hearts with a healed infarct. (A) A map of AP duration at 80% recovery. The zone under the red semi-circle corresponds to the infarct border zone (BZ), with the zone above the semi-circle being non-infarcted zone. Red arrows point to pixels from which sample traces in the (B) panel are extracted. (B) Sample traces from border and non-infarcted zone verifying the prolongation of the APs in the border zone (manifesting both earlier depolarization and later depolarization). The traces were scaled to have a similar amplitude and baseline, facilitating visual comparison. (C) Average activation map in the same recording. (D) Local conduction velocity visualization for panel (C), estimated by Bayly’s method17, implemented in COSMAS.

