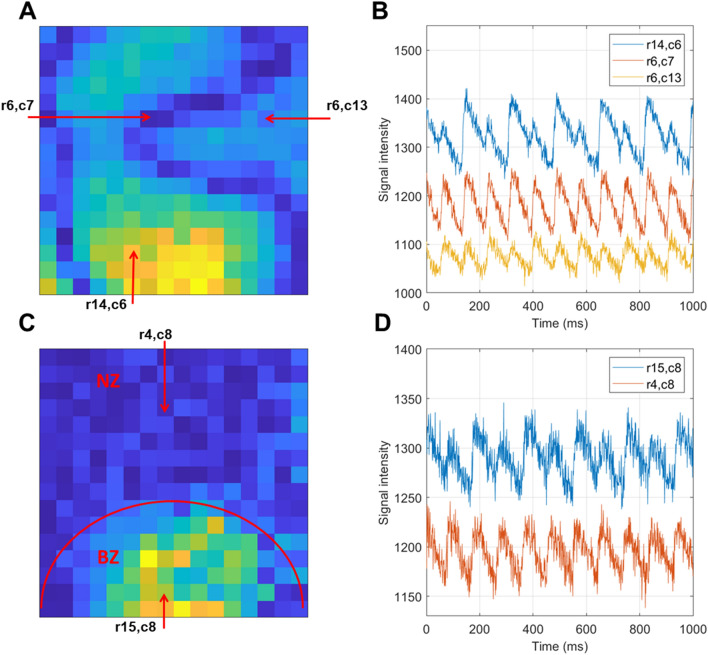
Figure 6.
Examples of alternans maps and traces. (A) Calcium transient amplitude alternans map corresponding to discordant alternans, with warmer colors corresponding to alternans with large amplitude. Dark blue zones are nodal lines separating zones of alternans in opposite phases. The pixels marked by red arrows with annotations giving the row and column indices are used in the subsequent panel. (B) Sample traces from the three marked pixels in the recording in (A), verifying that the alternans is discordant (blue and yellow traces have opposite phases) and that there is a lack of alternans in the nodal lines (red trace). (C,D) Similar format to (A,B), but showing spatially heterogeneous alternans in an infarcted heart, where alternans arises only in the infarct border zone (BZ) but not the non-infarcted zone (NZ).

