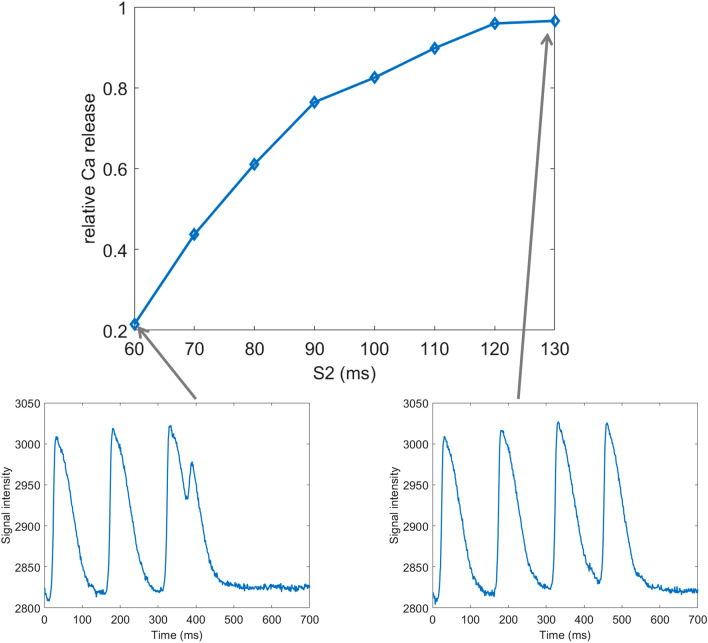
Figure 7.
An example of CaT amplitude restitution in S1-S2 protocol. In the top image is shown the relative CaT amplitude of the S2 stimulus versus S1 stimuli, demonstrating that for short S2 coupling interval, the CaT amplitude is reduced. CaT amplitude is defined as the upstroke amplitude (i.e. from the start of the CaT to the peak). Below the restitution curve are two examples of traces from which the curve was extracted: for S2 = 60 ms and S2 = 130 ms. The S1 coupling interval was 150 ms.

