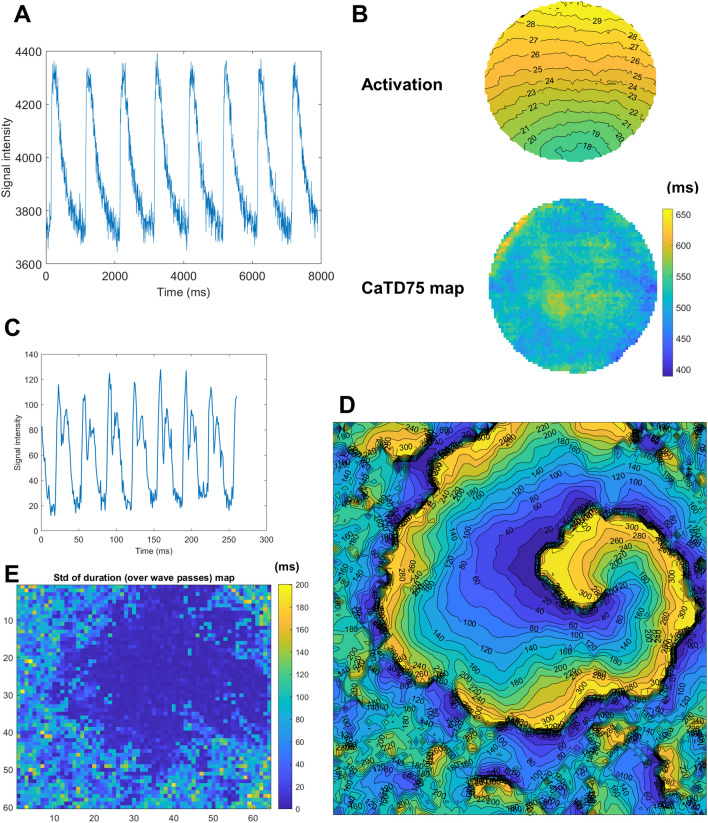
Figure 8.
Application of COSMAS to a dish of calcium-imaged monolayer. (A) Sample pixel trace (1 Hz pacing). (B) Activation map extracted from a culture dish showing calcium-based propagation (top) and a map of CaT duration (CaTD) measured at 80% recovery (bottom). (C) Sample trace from a recording obtained off-axis cell culture imaging19 showing characteristic “double-hump” motion transient morphology corresponding to cellular contraction and relaxation. (D) The activation map of a slow-conducting spiral wave imaged using off-axis imaging, with chaotic culture activation around the spiral. (E) The map of temporal standard deviation of duration of cellular activation, computed over multiple wave passes.

