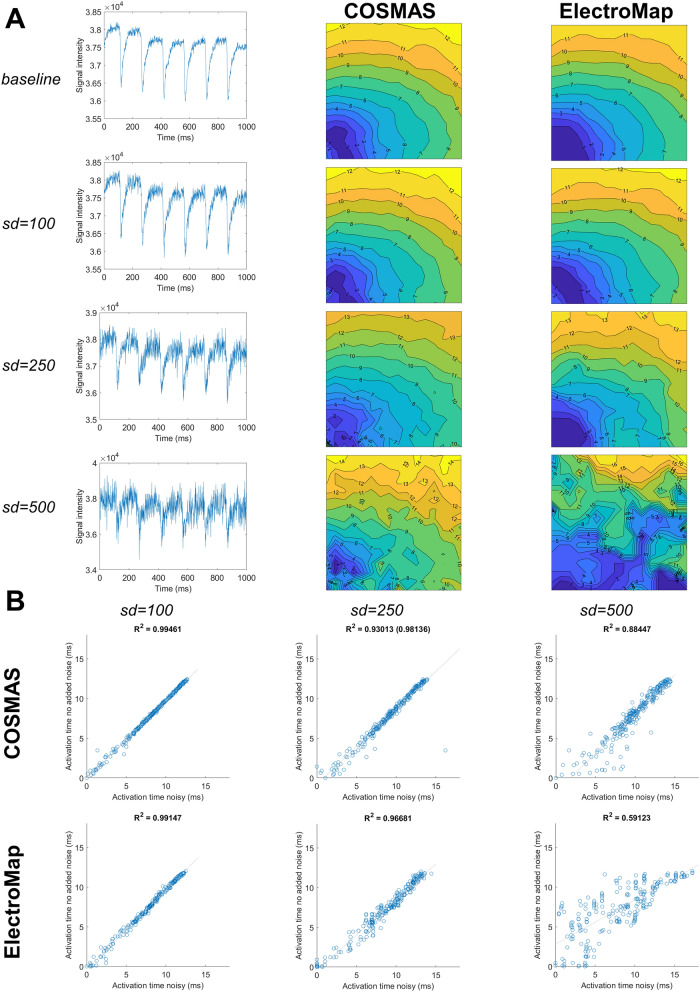
Figure 9.
Robustness of COSMAS’ and ElectroMap’s activation mapping to noise. (A) The four rows of images correspond to a baseline recording, and then the same recording with three levels of added noise (Gaussian noise with standard deviation of 100, 250, and 500). The first column shows a sample pixel trace from the center of the field of view, the second column gives the activation maps produced by COSMAS, with the third column displaying activation maps produced by ElectroMap. (B) A measure of how the extracted activation pattern changes with added noise. In the three columns is shown, for both tools, the correlation of activation times in the noisy recordings (x-axis) versus the activation times in control recording (y-axis). Tight correlation means that there is little change in activation detection with the added noise. Above the correlation plots is given the R2 statistic, corresponding to goodness-of-fit. In COSMAS, noise sd = 250, the R2 value in parentheses gives the statistic value after removal of one outlier point which perturbs the statistic markedly. Parameters of COSMAS and ElectroMap were matched whenever possible (see Methods for details). The original data with no added noise come from Langendorff-perfused rat hearts paced at 150 ms basic cycle length.

