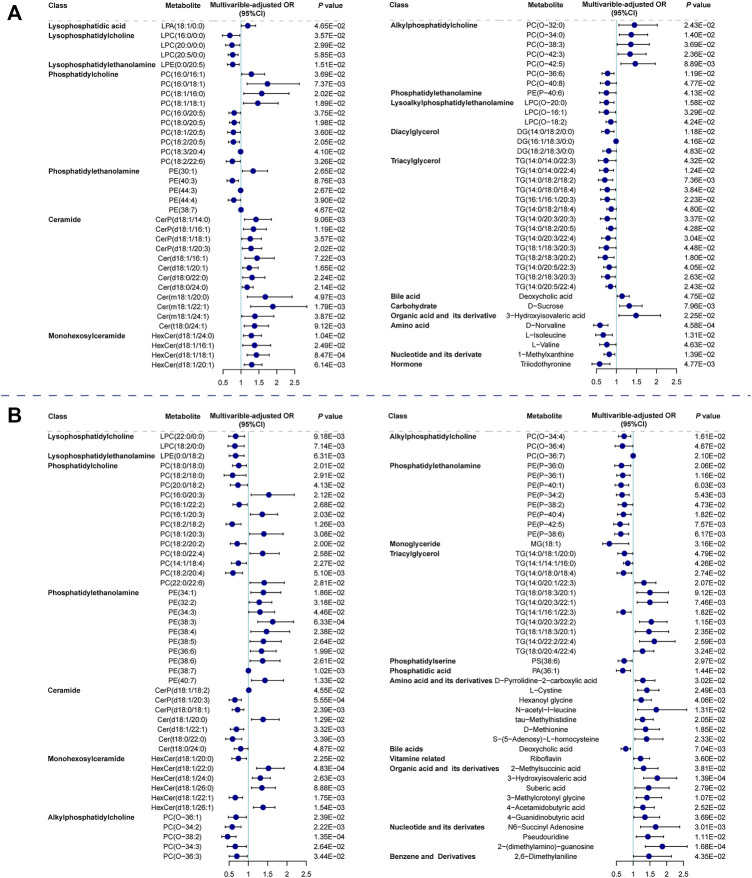
FIGURE 3.
Relationship between metabolic features against UA (vs. SCAD) and MI (vs. UA). Forest plot of odds ratios and 95% confidence intervals for logistic regression of individual metabolites/lipid species against (A) SCAD vs. UA (p < 0.05) (B) UA vs. MI (p < 0.05), adjusting for age, sex, hypertension, diabetes mellitus, smoking, LDLC, HDLC and TG. Cer, ceramide; CI, confidence interval; DG, diacylglycerol; HexCer, hexosylceramide; LPA, lysophosphatidic acid; LPC, lysophosphatidylcholine; LPC(O), lysoalkylphosphatidylethanolamine; LPE, lysophosphatidylethanolamine; MG, monoglyceride; OR, odds ratio; PA, phosphatidic acid; PC, phosphatidylcholine; PC(O), alkylphosphatidylcholine; PE, phosphatidylethanolamine; PE(P), phosphatidylethanolamine; PS, phosphatidylserine; other abbreviations as in Figures 1, 2.

