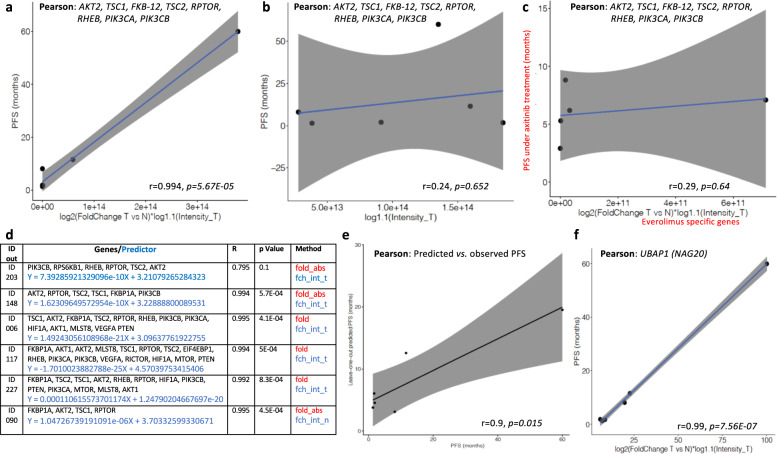
Fig. 2. DDPP correlation with PFS for patients treated with everolimus.
a Pearson correlation plots of the eight-gene predictor: AKT2, TSC1, FKB-12, TSC2, RPTOR, RHEB, PIK3CA, and PIK3CB with the PFS of six patients treated with everolimus as monotherapy: one patient out of these six had censored PFS (ID 203). X axis: absolute fold value of log2 based fold-changes tumor versus normal multiplied by log 1.1 based of the intensities in tumor values for each of the eight genes selected; Y axis: PFS under treatment with everolimus as monotherapy in months. b Pearson correlation plots of the eight-gene predictor: AKT2, TSC1, FKB-12, TSC2, RPTOR, RHEB, PIK3CA, and PIK3CB with the PFS of six patients treated with everolimus as monotherapy when only the tumor biopsy is investigated; X axis: absolute fold value of log 1.1 based of the intensities in tumor values for each of the eight genes selected; Y axis: PFS under treatment with everolimus as monotherapy in months. c Shuffle experiment: Pearson correlation plots of the 8 gene specific predictor for everolimus (AKT2, TSC1, FKB-12, TSC2, RPTOR, RHEB, PIK3CA, and PIK3CB) with the PFS of five patients treated with axitinib as monotherapy (Table 1); X axis: absolute fold value of log2 based fold-changes tumor versus normal multiplied by log 1.1 based of the intensities in normal values for each of the eight genes selected; Y axis: PFS under treatment with axitinib as monotherapy in months. d Leave-one-out experiments: each reiteration generates a predictor used to calculate PFS of the patient discarded. e Pearson correlation between leave-one-out predicted PFS and the observed PFS; X axis: predicted PFS as defined by leave-one-out (in months); Y axis: PFS under treatment with everolimus as monotherapy in months observed in WINTHER trial. f Pearson correlation plot for UBAP1 (NAG20) with the PFS of six patients treated with everolimus. X axis: log2 based fold-changes tumor versus normal multiplied by log 1.1 based of the intensities in tumor; Y axis: PFS under treatment with everolimus as monotherapy in months.

