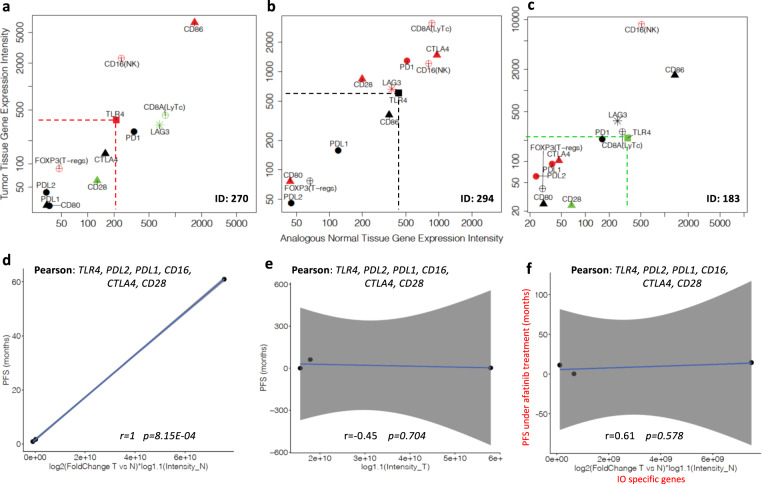
Fig. 3. DDPP intensity plots and correlation with PFS for patients treated with anti-PD-1 therapies.
a–c DDPP profiles of three patients treated with anti-PDL-1/PD-1 antibodies, with different PFS under treatment. Data source WINTHER trial11. a colon cancer: PFS = 0.9 months under treatment with atezolizumab, in fourth therapy line; b head and neck cancer: PFS = 1.7 months under treatment with nivolumab in second therapy line; c colon cancer: PFS = 61+ months under treatment with pembrolizumab, in third therapy line; Y axis: intensity of the expression in tumors; X axis: intensity of the expression in normal matched tissue. d Pearson correlation between a vectorial summation of 6 genes: TLR-4, PDL-2, PDL-1, CD16 (specific marker of NK), CTLA-4, and CD28; X axis: fold value of log2(fold change tumor versus normal) multiplied by intensity in normal values for each of the six genes selected; Y axis: PFS in months. e Pearson correlation between the vectorial summation of the six genes specific anti-PD-1: TLR-4, PDL-2, PDL-1, CD16 (specific marker of NK), CTLA-4, and CD28, and the PFS of three patients treated with IO when only tumor biopsy information is investigated; X axis: fold value of log2(intensity in tumor) values for each of the six genes selected; Y axis: PFS in months. f Shuffle experiment: Pearson correlation between the vectorial summation of the six genes specific anti-PD-1: TLR-4, PDL-2, PDL-1, CD16 (specific marker of NK), CTLA-4, and CD28, and the PFS of three patients treated with afatinib; X axis: fold value of log2(fold change tumor versus normal) multiplied by log 1.1(intensity in normal) values for each of the six genes selected; Y axis: PFS of three patients under afatinib treatment (months).

