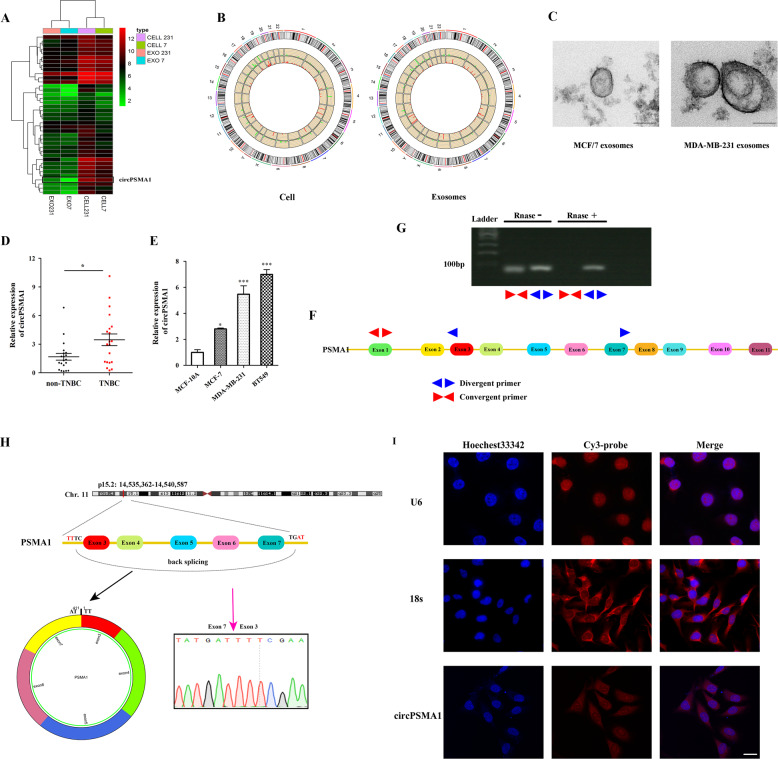
Fig. 1. Expression profiles of circRNAs in breast cancer cells and their exosomes and the characteristics of circPSMA1.
A The expression profiles of the top 39 differentially expressed circRNAs in MDA-MB-231 cells (TNBC cell line) and their exosomes compared with MCF-7 cells (non-TNBC cell line) and their exosomes. Pseudo-colors (green to red) indicate the expression levels from low to high. B The significantly differentially expressed circRNAs represent in Circos diagrams generated by Circos (http://circos.ca/) with the threshold criteria of fold change > 2.0 and P < 0.05. Red bars indicate upregulated circRNAs, while blue bars represent downregulated circRNAs. The height of the bar means the fold change of the expression level of a circRNA. C Representative images of exosomes from MDA-MB-231 cells and MCF-7 cells using a transmission electron microscope (TEM). Scale bar, 100 nm. D The expression level of circPSMA1 was verified in serum exosome samples from TNBC patients (n = 20) and non-TNBC patients (n = 20) by qRT-PCR analysis. E The expression level of circPSMA1 was verified in TNBC cell lines (BT-549 and MDA-MB-231), non-TNBC cell lines (MCF/7 and MCF-10A). F The schematic illustrates the regions of qRT-PCR primers for the genomic loci of PSMA1 gene and circPSMA1. Convergent primer for detecting linear PSMA1 and divergent primers for circPSMA1. G Gel electrophoresis analysis of RT-PCR for the existence of circPSMA1 in breast cancer cells. CircPSMA1 is only amplified by divergent primers in cDNA treated with RNase. H The genomic loci of PSMA1 gene and circPSMA1. Red arrow indicates the back-splicing region of PSMA1 exon 3 to exon 7 verified by Sanger sequencing. The circPSMA1 spliced mature sequence length is 411 nt. I The FISH assay shows the subcellular localization of circPSMA1. The circPSMA1 probe is labeled with Cy3 (red) and nuclei is stained with Hochest 33342 (blue) (magnification, ×200, Scale bar = 20 μm). All data were shown as mean ± SD at least three independent experiments, *p < 0.05, ***p < 0.001.

