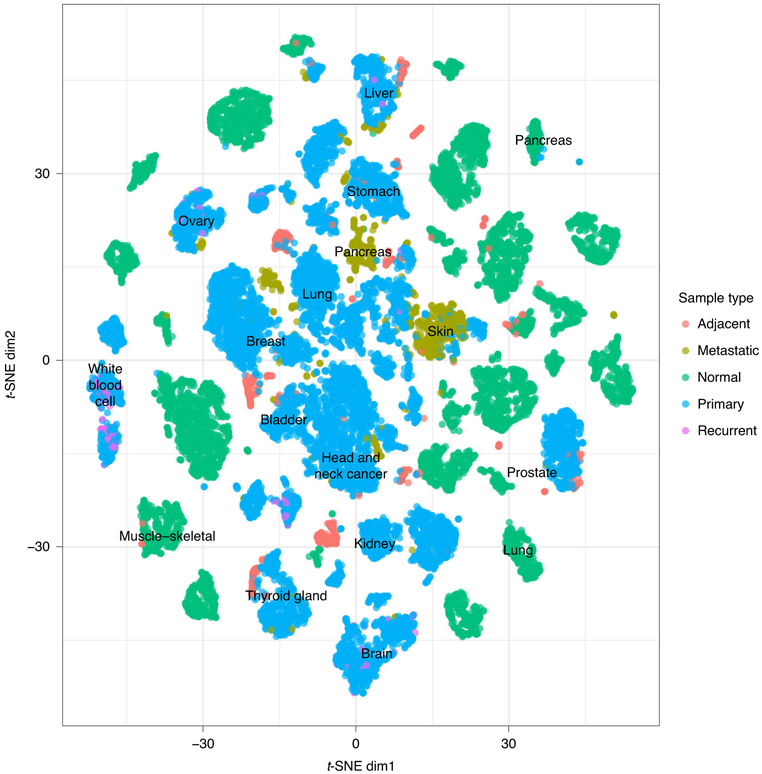
Fig. 2 ∣. OCTAD cancer maps.
Each dot represents one sample colored by sample type. x and y are the first two dimensions of the t-SNE plot. normal: normal tissue samples from GTEx; primary: primary cancer samples mainly from TCGA and TARGET; adjacent: normal tissues adjacent to primary cancer; metastatic: tissue samples from the metastasized site; recurrent: recurrent cancer tissue samples.

