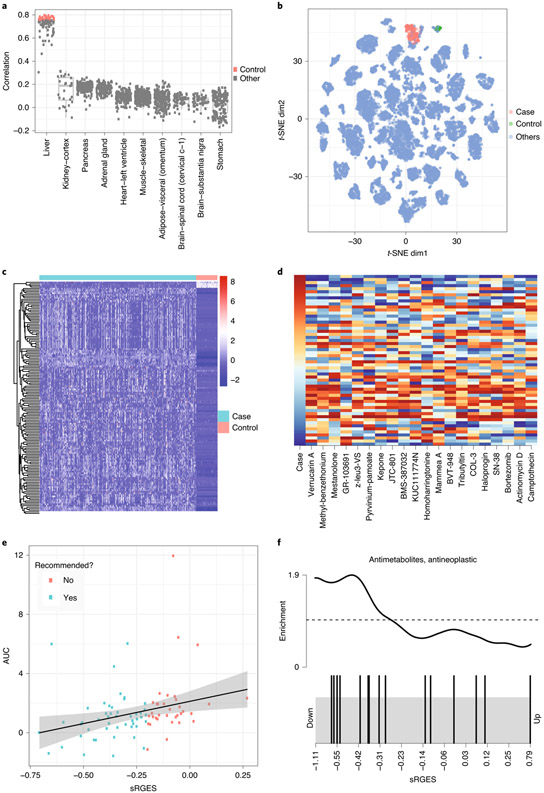
Fig. 5 ∣. Screen compounds targeting HCC.
a, Correlation between HCC tumor samples and all samples from normal tissues. Highly correlated samples (colored by red) were selected as control. b, Distribution of the samples selected for the HCC study in a cancer map. c, Disease signature visualization. Log TPM value is used. Rows are disease genes; columns are case and control samples. Red and blue show highly and weakly expressed genes, respectively. d, Top compounds that reverse the disease signature. The first column shows a disease signature gene expression; the remaining columns show drug signatures that reverse expression of the corresponding genes. In the first column, red and blue indicate high and low gene expression compared to control samples, respectively. In the remaining columns, red and blue indicate high and low gene expression induced by drug treatment, respectively. e, Correlation between sRGES (predicted score) and drug efficacy data in vitro. f, Enriched drug class. Drugs belonging to the antimetabolite and anti-neoplastic classes are represented as black bars. Lower sRGES means higher potency.

