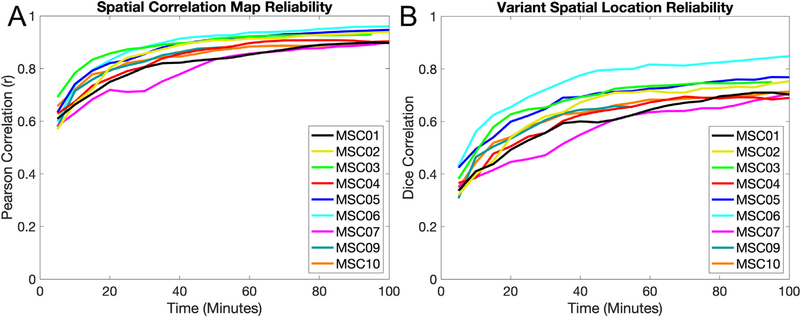
Fig. 2.
Reliability of network variants measured from task data. (A) Comparisons of individual-to-group spatial correlation maps from task data are shown for 5 min increments for each participant. The similarity between maps is calculated via Pearson correlation. Spatial correlation maps begin to plateau around 30–40 min at r > 0.8. (B) Comparisons of network variant maps (after binarization of the spatial correlations to the bottom 5% of spatial locations) from task data are shown in 5 min increments for each participant. The similarity between binarized spatial locations is calculated via Dice correlations. Binarized maps take longer (50–70 min.) and reach a slightly lower asymptote (Dice > 0.65), likely due to instability in the thresholding operation. Note that MSC09 (55 min) and MSC03 (95 min) did not have 100 min of data in their respective split-halves. A similar pattern was observed for the reliability of network variants in rest data (Fig. S1). Similar analyses were also performed using the non-residualized task data (Fig. S2) and data thresholded at r < 0.3 (Fig. S3).

