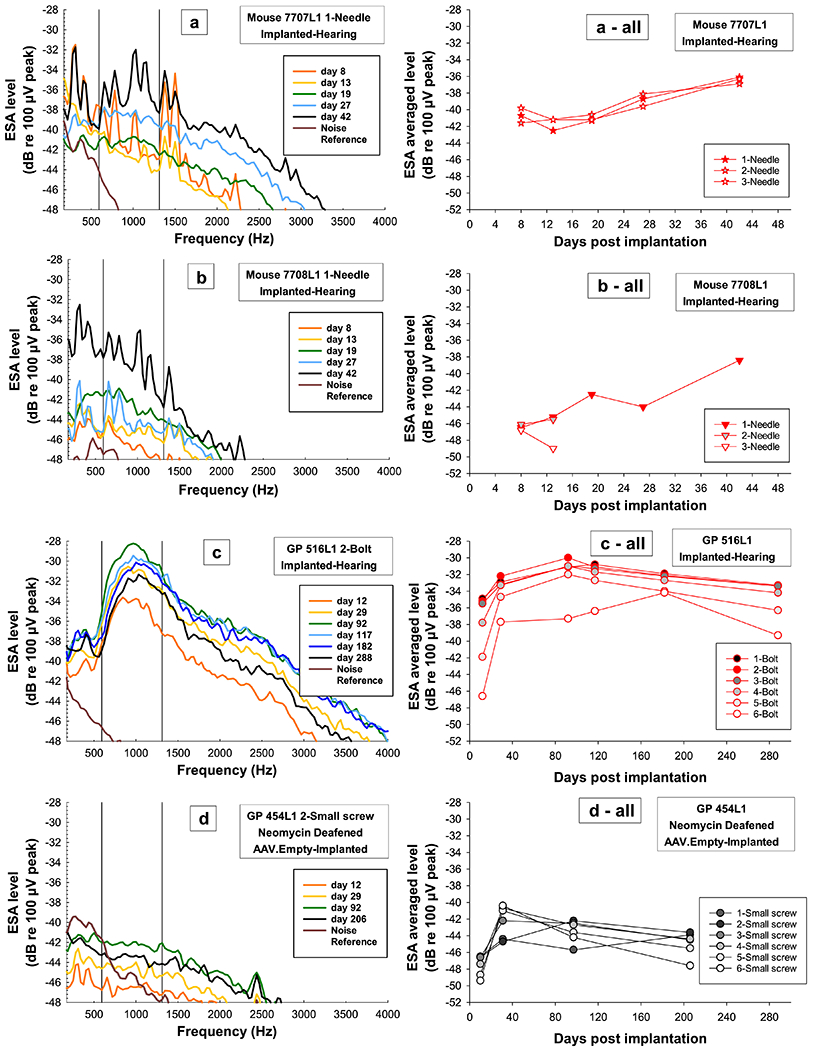
Figure 11.

ESA spectra examples (left column) from the primary electrode and average ESA levels over time for all electrodes (right column) for two mice (a and b) that were tested up to 42 DPI and two guinea pigs, one with good cochlear health tested up to 288 DPI (c) and one with poor cochlear health tested up to 206 DPI (d). ESA spectra (left column) reflect the spontaneous activity in the auditory nerve and for all animals and treatment groups (a, b, c, and d) show how spontaneous activity recovers and increases in level over time after surgery. ESA spectra are for the primary electrode to ground (needle, bolt, small screw); grounds from the mice were needles and for the guinea pigs either the bolt or small screw if the bolt was not making good contact). Color progressions on the spectra show changes over time with all final data points in black regardless of DPI; brown lines show the ambient noise in the system. Black vertical lines represent the frequency range (593.75-1312.5 Hz) in which a “normal” ESA level would occur in guinea pigs if hair cells were present. ESA levels were averaged over this frequency range to make it possible to compare animals with the peak (a, b and c) to animals without the peak (d) and to give a metric for presence and absence of IHCs and spontaneous activity levels. These ESA averaged levels over time are plotted (right column) to show how spontaneous activity increases with time after surgery (DPI) regardless of species, treatment group or electrode location; mice were still increasing up to 42 DPI and guinea pigs increased and then showed long-term stable trends. ESA averaged levels are for all electrodes and were coded by individual symbols for each mouse and circles for guinea pigs; colors were coded by IHC survival in Profiles A through C; red = high, yellow = medium to low, and black = no IHC survival).
