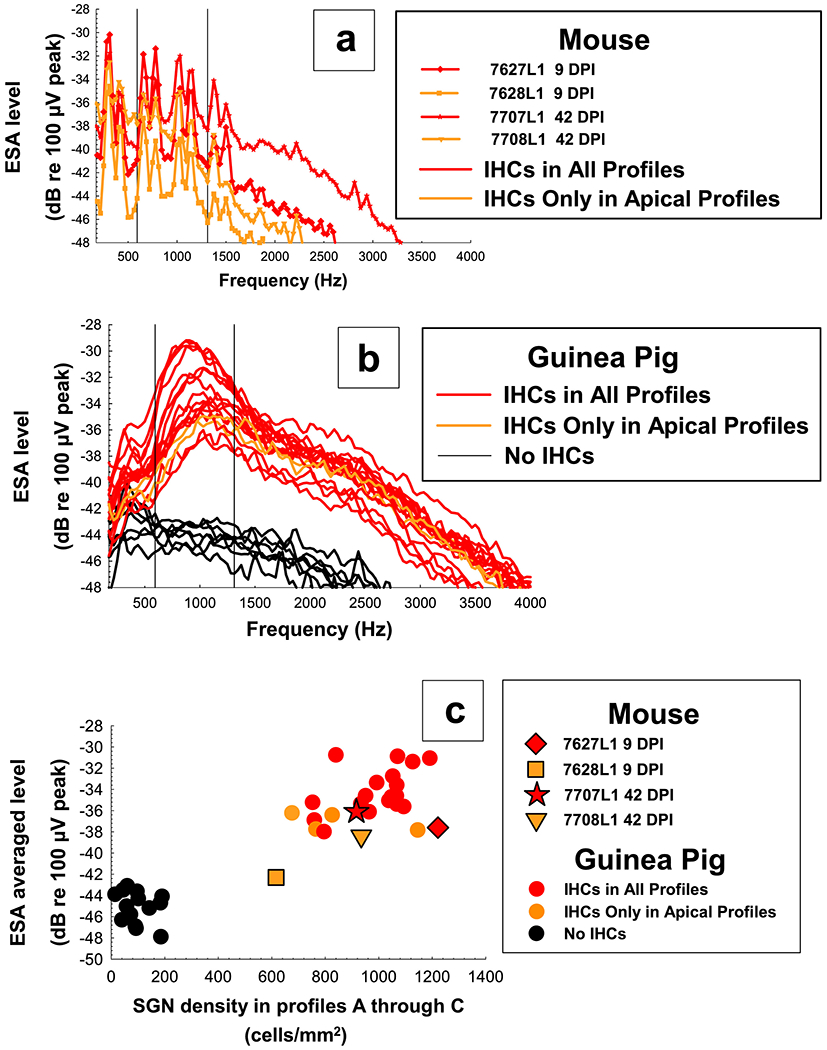
Figure 12.

ESA spectra for mice (top panel, a) and guinea pigs of varying cochlear health (middle panel, b) on the final day tested. ESA averaged levels of these spectra have been plotted as a function of average SGN density for histology Profiles A through C (bottom panel, c) to show how these four mice have similar average ESA levels to guinea pigs of comparable cochlear health. ESA levels for each mouse and guinea pig represent one representative spectra obtained on the last day usable data was collected. Individual symbols are specified for each mouse and circles for guinea pigs. Colors were coded by IHC survival in Profiles A through C; red = high, yellow = medium to low, and black = no IHC survival.
