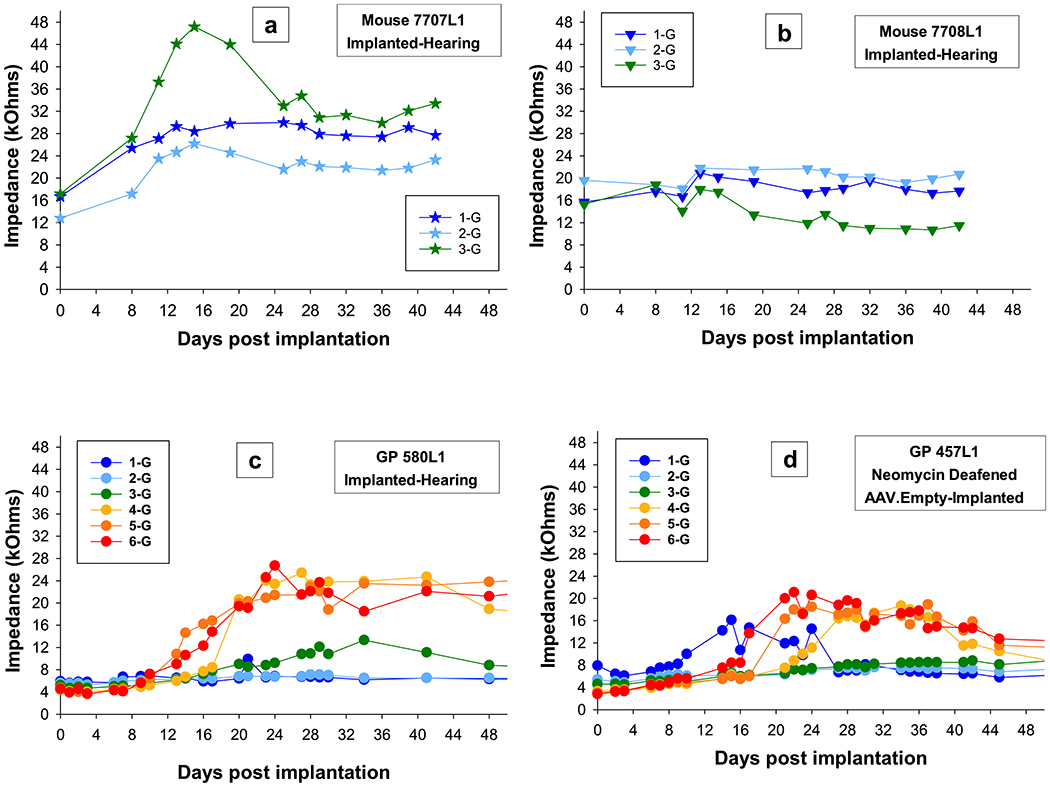
Figure 13.

Impedances over time for all electrodes for the two mice (a and b) that were tested up to 42 DPI and two guinea pigs, one with good cochlear health (c) and one with poor cochlear health (d). Impedances in mice and guinea pigs were similar in changes over time with impedances for individual electrodes showing one of four trends: 1) impedances that have a gradual increase and then stabilize, 2) impedances that show a gradual increase and then decrease to a steady state, 3) impedances that have a decrease to a steady state, and 4) impedances that show no change. Individual symbols are specified for each mouse and circles for guinea pigs. Colors progress from blue to red and represent the apical to basal electrodes.
