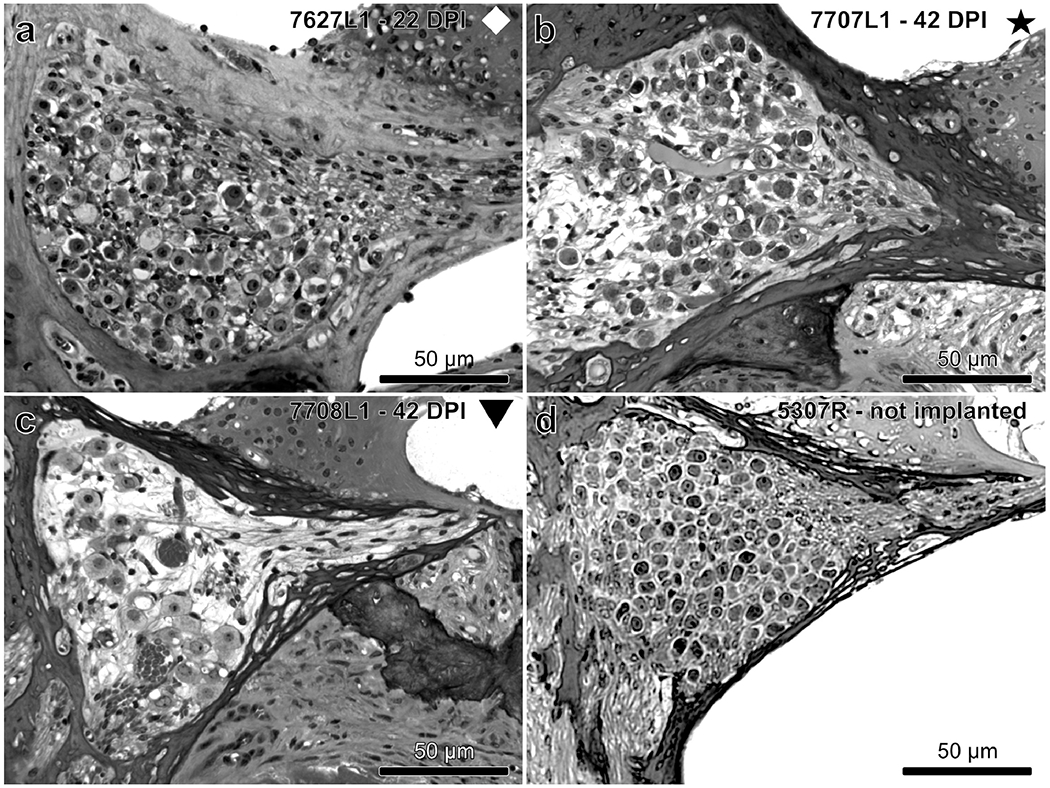
Figure 3.

Examples of the variability seen in SGN density in Rosenthal’s canal of mice with a multichannel cochlear implant (a – c) compared to a normal non-implanted mouse (d) taken from Profile A. SGN density appears high (a), medium (b) or low (c). Intrascalar tissue (fibrosis and bone; partially seen) is absent in (a) but present in (b) and (c). Symbols indicate the identities of the mice throughout the manuscript.
