Figure 5.

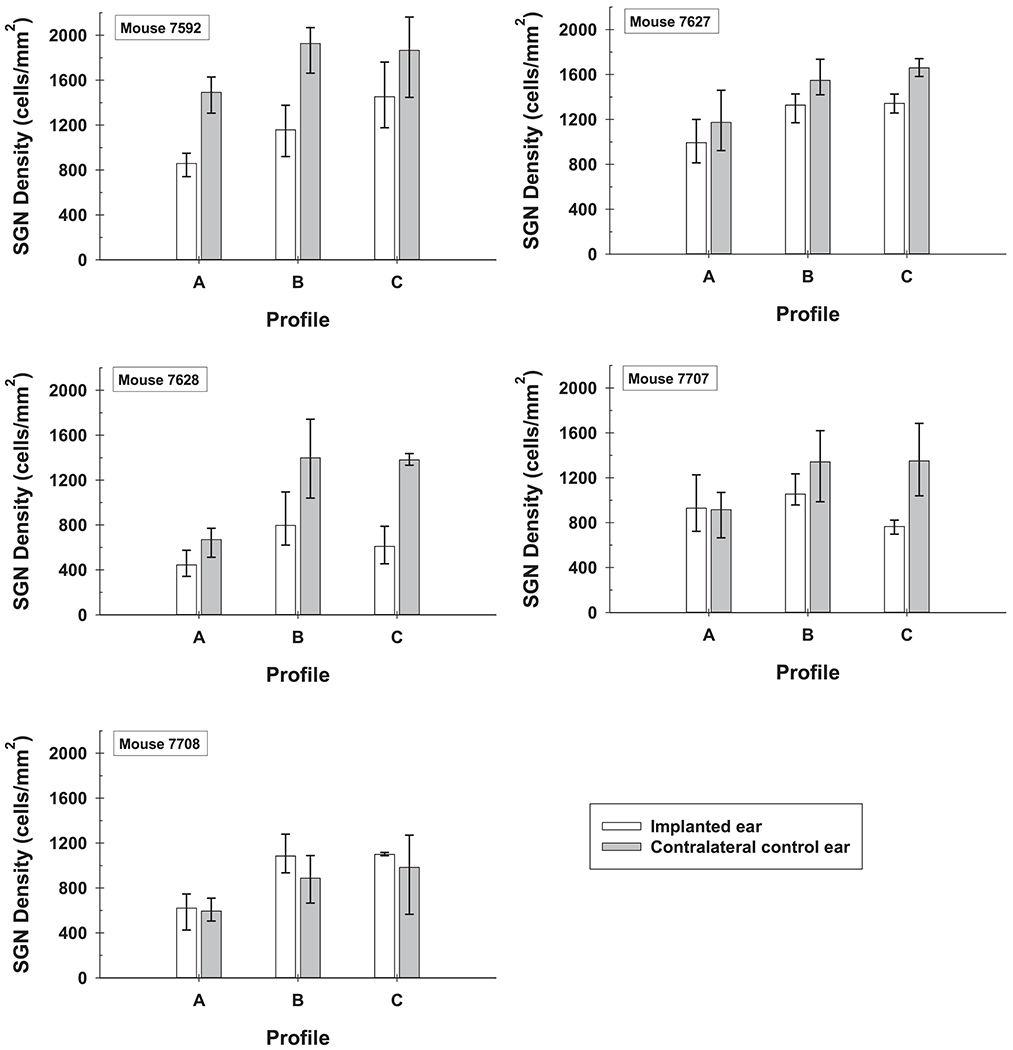
Comparison of SGN density throughout the cochlea (Profiles A through C) for implanted and non-implanted ears of all five mice. Error bars are the range of SGN densities (maximum to minimum) for the 3 histological sections analyzed per ear.

Comparison of SGN density throughout the cochlea (Profiles A through C) for implanted and non-implanted ears of all five mice. Error bars are the range of SGN densities (maximum to minimum) for the 3 histological sections analyzed per ear.